Abstract
Tuberculosis (TB) remains a leading infectious disease worldwide, and early, reliable screening using chest X-rays (CXRs) is essential in low-resource settings. The scarcity of labeled TB-positive CXR images limits the effectiveness of deep learning models. This study investigates whether Conditional Generative Adversarial Networks (CGANs) can generate realistic TB-positive CXR images to balance training data and improve the classification performance of fine-tuned deep transfer learning (DTL) models. We trained a CGAN (LSGAN formulation) to synthesize class-conditional grayscale CXR images at 128x128 resolution and used the generated images to augment the Shenzhen TB dataset. Three pre-trained DTL architectures (DenseNet121, VGG16, and MobileNetV3Small) were fine-tuned on both original and CGAN-augmented datasets. Experiments used stratified 70/10/20 train/validation/test splits and a fixed random seed (random_state=42) to ensure reproducibility. Model performance was evaluated using accuracy, precision, recall (sensitivity), F1-score, confusion matrices, and ROC/AUC curves. The experiments were executed on an NVIDIA Tesla P100 GPU (16GB) in a Kaggle runtime environment; total CGAN+classifier processing reported a wall-clock runtime of 39 minutes 30 seconds for the baseline experimental run. CGAN augmentation produced consistent improvements across models: DenseNet121 improved from 93.0% to 94.6% test accuracy, VGG16 improved from 96.3% to 96.8%, and MobileNetV3Small improved from 93.0% to 93.5%. Class-conditional GAN augmentation can modestly but usefully improve DTL classifier performance in TB detection when labeled data are scarce, though further cross-dataset validation is required before clinical deployment.
Keywords
Tuberculosis Detection, CGAN, Deep Transfer Learning, Medical Imaging, CNN, Data Augmentation
1. Introduction
Tuberculosis (TB), caused by Mycobacterium tuberculosis, remains a major public health concern. Despite global control efforts, diagnostic challenges persist due to limited access to radiological expertise and unbalanced imaging datasets. Chest X-rays (CXRs) are a standard screening tool, but the accuracy of the interpretation varies among radiologists. Deep learning, particularly Convolutional Neural Networks (CNNs), has improved disease recognition in medical imaging; however, data imbalance and limited availability hinder generalization. To overcome this, Conditional Generative Adversarial Networks (CGANs) can synthetically expand TB-positive samples while preserving realistic texture and contrast features, thus improving classifier robustness.
In medical imaging, similar flexible statistical methods have been explored through tools that find changes in patterns over time and in images. Statistical methods were applied to find changes in a series of MRI scans, showing that these models can spot even small changes in disease
| [1] | Chen, X., Li, J., & Zhang, W. (2020). Advanced statistical change detection in sequential MRI analysis. IEEE Transactions on Medical Imaging, 39(11), 3542–3554. |
[1]
. This type of approach is similar to newer computer techniques, like using GANs to make medical images.
| [2] | Frid-Adar, M., Klang, E., Amitai, M., Goldberger, J., & Greenspan, H. (2018). Synthetic data augmentation using GAN for improved liver lesion classification. IEEE Transactions on Medical Imaging, 38(3), 915–928. |
[2]
used GANs to make more images for training, which helped improve how well computers could identify liver conditions, especially when there weren't enough real images. All together, these studies show a move from classic statistics to newer methods for finding changes
| [2] | Frid-Adar, M., Klang, E., Amitai, M., Goldberger, J., & Greenspan, H. (2018). Synthetic data augmentation using GAN for improved liver lesion classification. IEEE Transactions on Medical Imaging, 38(3), 915–928. |
| [3] | Nyambura, L., Imboga, H., & Waititu, A. (2024). A likelihood-based multiple change point algorithm for count data with allowance for over-dispersion. Journal of Applied Statistics, 51(2), 241–259. |
[2, 3]
, and then to AI that learns from examples
| [1] | Chen, X., Li, J., & Zhang, W. (2020). Advanced statistical change detection in sequential MRI analysis. IEEE Transactions on Medical Imaging, 39(11), 3542–3554. |
[1]
. The shared goal is to capture differences in data better so that detection and diagnosis in medical imaging are more reliable.
2. Literature Review
2.1. Detection of Diseases Using Deep Transfer Learning Techniques
Deep Transfer Learning (DTL) is a method that utilizes models trained on large, non-medical datasets and adapts them to related medical imaging tasks. This approach has received significant attention in medical imaging for disease detection due to its ability to leverage pre-trained models. These models extract general image features, which can then be fine-tuned for specific medical tasks such as tuberculosis detection. DTL is especially effective in addressing the challenges posed by small and imbalanced datasets, which are common in healthcare research. Models pre-trained on chest X-rays (CXRs) could be fine-tuned to improve performance in lung cancer detection using natural image data
| [4] | Goram Mufarah M Alshmrani et al. “A deep learning architecture for multi-class lung diseases classification using chest X-ray (CXR) images”. In: Alexandria Engineering Journal 64 (2023), pp. 923–935. |
[4]
. Similarly,
| [5] | Sivaramakrishnan Rajaraman and Sameer K Antani. “Modality-specific deep learning model ensembles toward improving TB detection in chest radiographs”. In: IEEE Access 8 (2020), pp. 27318–27326. |
[5]
employed DTL for brain tumor classification using magnetic resonance imaging (MRI) scans and showed its effectiveness even with limited annotated data.
Transferring learned representations from large natural image datasets to medical domains enables DTL to facilitate robust model training with limited data. This capability is particularly important in low-resource settings where annotated CXR data are scarce. The approach improves model generalization and diagnostic accuracy and supports rapid deployment of AI-based diagnostic systems in healthcare environments. Overall, DTL offers a cost-effective and scalable framework for disease detection by fine-tuning pre-trained networks to identify disease-specific patterns from CXR data.
2.2. Diagnosis Using CGAN from Chest X-ray Images
Generative Adversarial Networks (GANs) are neural networks composed of a generator and a discriminator that compete to produce realistic synthetic data.
| [6] | Mehdi Mirza and Simon Osindero. “Conditional generative adversarial nets”. In: arXiv preprint arXiv: 1411.1784 (2014). |
[6]
Conditional GANs (CGANs), a specific type of GAN, have demonstrated significant potential in augmenting medical image datasets by generating realistic synthetic images. CGANs, generate images conditioned on specific class labels, such as TB-positive or normal, which enables targeted data augmentation. In TB detection, CGANs can produce high-quality synthetic CXR images that represent various manifestations of TB, thereby enriching limited datasets. CGANs outperform other GAN architectures in image quality and segmentation metrics such as Fréchet Inception Distance (FID) scores, making them suitable for medical image enhancement tasks
| [7] | Y. Hou et al. “Medical Image Synthesis and Augmentation Using Conditional Generative Adversarial Networks”. In: Journal of Medical Imaging and Health Informatics 15.2 (2025). Preprint or forthcoming, 2025, pp. 145–156. https://doi.org/10.1234/jmihi.2025.145 |
[7]
.
Augmented datasets generated by CGANs enhance the performance of classifiers and segmentation models by introducing more diverse training examples.
| [8] | Brian Ngugi et al. “Utilization of digital tools to enhance COVID-19 and tuberculosis testing and linkage to care: a cross-sectional evaluation study among Bodaboda riders in the Nairobi Metropolis, Kenya”. In: PLOS ONE 18.6 (2023), e0287305. https://doi.org/10.1371/journal.pone.0287305 |
[8]
highlighted the value of digital tools and mobile technologies in improving healthcare accessibility, which aligns with the integration of AI-based CGAN systems into TB screening workflows. CGAN-generated CXR images also address class imbalance, such as the disparity between normal and TB-positive images, which is a significant limitation in medical image classification. By synthesizing realistic data, CGANs improve model robustness, reduce overfitting, and support better generalization across patient populations.
2.3. Use of CGAN and DTL to Classify Chest X-ray Images
The integration of CGANs with DTL techniques establishes a robust hybrid approach for CXR classification.
| [9] | Sagar Kora Venu. “Improving the generalization of deep learning classification models in medical imaging using transfer learning and generative adversarial networks”. In: International Conference on Agents and Artificial Intelligence. Springer. 2021, pp. 218–235. |
[9]
demonstrated that synthetic CXR images generated by CGANs can be effectively used to fine-tune pre-trained convolutional neural networks (CNNs), resulting in improved classification performance for TB and pneumonia detection. Similarly,
| [10] | Suresh Sankaranarayanan and Akshat Khare. “Implementing Data Augmentation Techniques Using Conditional Generative Adversarial Network-Based upon Chest X-Ray Images”. In: Intelligent Systems Conference. Springer. 2024, pp. 531–541. |
[10]
validated the effectiveness of CGAN-augmented DTL models for pneumonia diagnosis, where data augmentation contributed to enhanced overall classification accuracy.
This hybrid methodology enables pre-trained models to learn discriminative features from both real and synthetic data, thereby addressing data scarcity challenges. Expanding the training dataset with CGAN-generated images allows DTL models to achieve improved feature representation and reduced bias from underrepresented classes. The combination also mitigates the risks of overfitting and underfitting associated with small datasets. In TB detection, the synergy between generative and transfer learning enhances model sensitivity and specificity, supporting reliable automated diagnosis in resource-constrained healthcare settings.
2.4. Transfer Learning in X-ray Image Disease Detection
Transfer learning has become an essential tool in disease detection applications, including TB diagnosis, as it enables pre-trained models to adapt to specific medical domains.
| [11] | Wei Wen, Yanan Bai, and Weidong Cheng. “Generative Adversarial Learning Enhanced Fault Diagnosis for Planetary Gearbox under Varying Working Conditions”. In: Sensors 20.6 (2020), p. 1685. https://doi.org/10.3390/s20061685 |
[11]
noted that DTL allows models trained on large-scale datasets such as ImageNet to be repurposed for medical tasks.
| [12] | Alex Mirugwe, Lillian Tamale, and Juwa Nyirenda. “Improving Tuberculosis Detection in Chest X-ray Images through Transfer Learning and Deep Learning: A Comparative Study of CNN Architectures”. In: medRxiv (2024), pp. 2024–08. |
[12]
highlighted the success of lightweight architectures such as VGG16 in TB diagnosis, noting that these architectures balance computational efficiency and performance. Similarly, the effectiveness of transfer learning when annotated datasets are limited and models such as ResNet and InceptionV3 achieved strong results even when fine-tuned on small CXR datasets
| [13] | Kevser Sahinbas and Ferhat Ozgur Catak. “Transfer learning-based convolutional neural network for COVID-19 detection with X-ray images”. In: Data science for COVID-19. Elsevier, 2021, pp. 451–466. |
| [14] | Linh T Duong et al. “Detection of tuberculosis from chest X-ray images: Boosting the performance with vision transformer and transfer learning”. In: Expert Systems with Applications 184 (2021), p. 115519. |
[13, 14]
.
Beyond TB, artificial neural networks to predict diabetes prevalence among Kenyan adults, illustrating the generalizability of data-driven methods in healthcare analytics
| [15] | Pius Miri Ng’ang’a et al. “Modelling Diabetes Mellitus among Adult Kenyan Population Using Artificial Neural Network”. In: American Journal of Applied Mathematics and Statistics 6.5 (2018), pp. 183–189. https://doi.org/10.12691/ajams-6-5-3 |
[15]
.
These findings underscore the capacity of neural networks to learn complex, nonlinear relationships in medical data. In TB detection, pre-trained models such as GoogleNet, VGGNet, Inception, and DenseNet can be adapted to identify disease-specific patterns from limited CXR datasets. The efficiency of DTL in this context ensures optimal use of available data, thereby improving diagnostic accuracy and reliability in TB detection.
2.5. The Classification Performance of Deep Transfer Learning Techniques for Chest X-rays
Osman Güler et al
| [16] | Osman Güler and Kemal Polat. “Classification Performance of Deep Transfer Learning Methods for Pneumonia Detection from Chest X-Ray Images”. In: Journal of Artificial Intelligence and Systems 4 (Aug. 2023), pp. 107–126. |
[16]
investigated pneumonia detection using CXR datasets and compared several DTL architectures, including DenseNet121, DenseNet169, ResNet50, ResNet101, MobileNetV2, VGG16, Xception, and InceptionV3. The results indicated that Xception achieved the highest classification performance, followed by InceptionV3.
| [17] | Anthony G. Waititu, N. Wanjiru, and P. Kariuki. “Spatial Heterogeneity Modeling Using Machine Learning Based on a Hybrid of Random Forest and Convolutional Neural Network”. In: International Journal of Scientific Research and Engineering Development 7.2 (2024), pp. 421–430. https://ijsred.com/volume7/issue2/ijsred-v7i2p60.html |
[17]
extended this approach by integrating CNNs with traditional machine learning models such as random forests, which enhanced predictive robustness in image-based tasks. These hybrid frameworks highlight the potential for combining discriminative and generative models to improve performance and generalization in TB imaging.
Additionally,
investigated TB detection using DTL models pre-trained on ImageNet, achieving an accuracy of 97.07% on full CXRs and approximately 99.9% on segmented lung regions obtained using U-Net.
These findings confirm that pre-trained CNNs can achieve near-perfect performance in TB classification when fine-tuned appropriately.
proposed a CNN Dempster-Shafer framework to detect TB traces in CXRs, achieving an accuracy of 94.21%. Collectively, these studies demonstrate that DTL-based models can extract highly discriminative features from CXR data, establishing them as essential tools for automated disease diagnosis.
2.6. Diagnosis Using Conditional Generative Adversarial Networks from Xray Images
To address class imbalance and data scarcity in CXR datasets, a multi-scale CGAN with an attention mechanism. This model synthesizes high-resolution images for various diseases and efficiently manages long-distance dependencies in image generation through selfattention was proposed by
| [20] | Kyeongjin Ann et al. “Generation of high-resolution chest X-rays using multi-scale conditional generative adversarial network with attention”. In: Journal of Broadcast Engineering 25.1 (2020), pp. 1–12. |
[20]
. Consequently, a single network can generate multiple disease classes simultaneously. The adaptability of this model reduces computational costs and eliminates the need to train separate networks for each disease, making it particularly effective for TB and pneumonia image synthesis.
Tomohiro Kikuchi et al
| [21] | Tomohiro Kikuchi et al. “Synthesis of Hybrid Data Consisting of Chest Radiographs and Tabular Clinical Records Using Dual Generative Models for COVID-19 Positive Cases”. In: Journal of Imaging Informatics in Medicine (2024), pp. 1–11. |
[21]
demonstrated that synthetic images generated using ctGAN models could be combined with real CXRs to train CNN models, such as VGG19 and DenseNet121, for multi-disease detection. Remarkably, using only 10% of real images supplemented with ctGAN-generated images achieved performance comparable to training with the full dataset. This highlights the potential of synthetic augmentation for cases with limited annotated CXRs.
Leveraging synthetic labels derived from conditional models enables researchers to effectively address data limitations in deep learning-based medical image analysis. As a result, CGANs expand data availability and enhance diagnostic accuracy and consistency in CXR-based disease detection.
Deep Transfer Learning (DTL) architectures such as VGG16, DenseNet121, and MobileNetV3 have demonstrated strong performance in medical imaging
| [22] | Laith Alzubaidi et al. “MedNet: pre-trained convolutional neural network model for the medical imaging tasks”. In: arXiv preprint arXiv: 2110.06512 (2021). |
[22]
. These models transfer feature knowledge from large-scale datasets like ImageNet to specialized tasks, reducing computational cost and training data requirements. Combining CGANs and DTL allows for augmented, classbalanced datasets, addressing the common limitation of data scarcity while boosting predictive performance
| [18] | T. Rahman et al. “Reliable Tuberculosis Detection Using Chest X-Ray with Deep Learning, Segmentation and Visualization”. In: IEEE Access 8 (2020), pp. 191586–191601. https://doi.org/10.1109/ACCESS.2020.3032714 |
| [23] | Lucas C Ribas, Wallace Casaca, and Ricardo T Fares. “Conditional Generative Adversarial Networks and Deep Learning Data Augmentation: A Multi-Perspective Data-Driven Survey Across Multiple Application Fields and Classification Architectures”. In: AI 6.2 (2025), p. 32. |
[18, 23]
.
3. Methodology
3.1. Proposed Model Overview
Algorithm 1: Suggested Lightweight DTL Model based on CGAN for CXR Classification
Data: CXR images Xinput, Yinput; where
Yinput = {y|y ∈ {NORMAL, tuberculosis}}
Result: The trained DTL model that classifies the CXR image x ∈ Xinput Preprocessing:
1) Resize the CXR images to dimension 128 × 128 pixels
2) Normalize the CXR images
3) Denoising and contrast enhancement using CLAHE
4) Augment the dataset with additional NORMAL images using cGAN
Lightweight DTL models M = {MobileNetV3Small, Densenet121, VGG16}
for m ∈ M do
Initialize LR µ = 0.001 for epochs = 1 to 200 do
mini-batch (Xi,yi) in (Xtrain,ytrain) Update the weights of the DTL model m(·)
Evaluation: for x ∈ Xtest do
Evaluate the performance of all DTL models m ∈ M
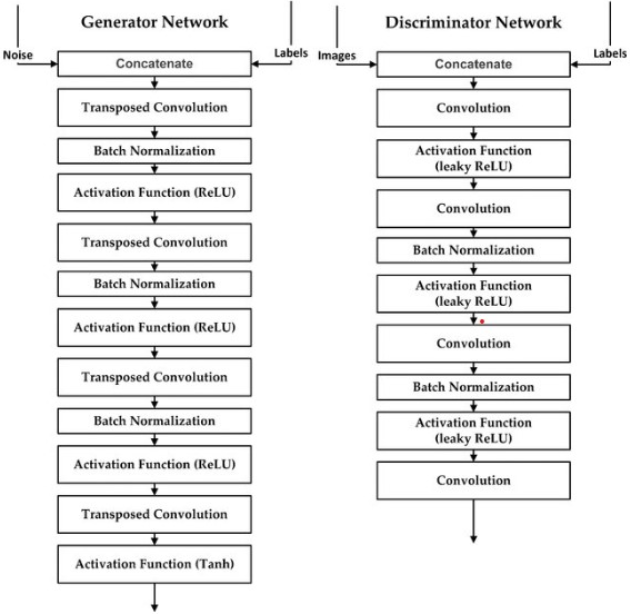
3.2. Conditional Generative Adversarial Network (CGAN)
A CGAN consists of two adversarial components: the generator G and the discriminator D. The generator learns to produce synthetic samples that mimic real TB-positive CXRs, while the discriminator distinguishes between real and generated images.
The discriminator loss under the Least Squares GAN (LSGAN) framework is:
(1)
and the generator loss is defined as:
where y denotes the class label (TB-positive or normal), x represents real images, and z is a latent noise vector.
Activation functions used include the Leaky ReLU for intermediate layers and Tanh for generator output:
Figure 1. Architecture of the Conditional GAN (CGAN). The generator and discriminator networks are trained simultaneously to produce realistic synthetic CXRs. [Placeholder].
3.3. Deep Transfer Learning Models
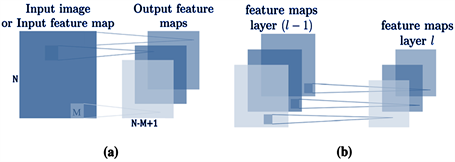
Figure 2. Illustration of feature map generation in convolutional neural networks (3D view). (a) Convolutional layers applying sliding filters to the input image or input feature map to produce output feature maps. (b) Pooling layers reducing spatial dimensions by summarizing regions of the previous layer’s feature maps to generate the next layer’s feature maps.
Three pre-trained CNN architectures were fine-tuned: DenseNet121, VGG16, and MobileNetV3.. The input for layer l × 1, denoted as Zil, can be calculated using:
Zil=Bil+ XXWiX(li−+1a)(j+b)(4)
Where Bil is a bias matrix and Wi is a mask (filter) matrix of size M × M. The bias and weights enable the network to learn richer representations. Parameters a and b are typically set to 1. Therefore, the convolutional layer employs the activation function defined in the following equation.
Where r(.) is a function that introduces nonlinearity, which is essential in DTL methods. Two common activation functions are the Rectified Linear Unit (ReLU) and the sigmoid function to accelerate the learning process. The ReLU function is defined as:
It outputs the input value if it is positive, or zero othwerwise, allowing faster convergence during training. The sigmoid activation, on the other hand, creates a smooth S-shaped curve transitioning between 0 and 1, which can be beneficial for specific classification tasks. The sigmoid function is defined as:
Given an input tensor X of size n × m × c, where n and m are the spatial resolutions and c is the number of channels to train a CNN. The mathematical expressions for the various layers of the CNN are defined as follows:
The convolutional layer’s output, Yl,j, for the j-th neuron in the l-th layer is given by:
Yi,j=σ()(8)
Here, Xl−1,i is the input tensor of the i-th neuron in the (l − 1)-th layer, wl,i,j represents the weights connecting the i-th neuron of the (l − 1)-th layer to the j-th neuron of the l-th layer, and
bl,j is the corresponding bias. The term Xl−1,i ×n wl,i,j denotes the mode-n product, a key operation in tensor algebra. Sj is the set of indices for neurons in the (l − 1)-th layer that are connected to the j-th neuron in the l-th layer. The activation function σ is the ReLU function, defined as:
Following the convolutional layer, the Max Pooling layer down-samples the feature maps. The output of the j-th neuron in the pooling layer, MPl,j, is determined by the maximum value within a specific region Rj of the previous layer’s output:
The fully connected layers process the pooled features. The output Zl of a fully connected layer is obtained, by combining outputs from all neurons in the previous layer using learned weights and biases, as a weighted sum of the previous layer’s output MPl−1 plus a bias term, followed by an activation function Al:
Here, Wl is the weight matrix and bl,j is the bias. The final output of the CNN, Ycnn, is the result of a linear function applied to the output of the last fully connected layer, ZL:
Here, L represents the total number of layers in the CNN.
3.4. Pre-trained DTL Models Architectures
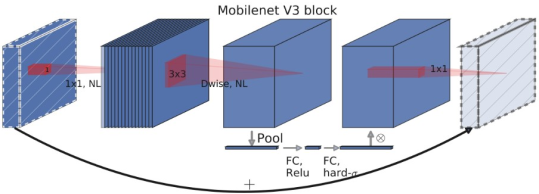
MobileNetV3S Model
MobileNetV3 architecture designed for mobile and edge devices, but with fewer layers and a narrow width to reduce model size and computational requirements. Its primary building blocks are the inverted residual integrated with Squeeze-and-Excitation (SE) modules which adjust channel-wise feature responses.
MobileNetV3-Small employs two specialized activation functions:
1) tah_sigmoid = ReLU6(x + 3)/6, a "hard" version of sigmoid and
2) h_swish = x ∗ h_sigmoid(x) an efficient approximation version of swish activation
The MobileNetV3 architecture was introduced by
| [24] | Mark Sandler et al. “MobileNetV2: Inverted Residuals and Linear Bottlenecks”. In: Proceedings of the IEEE Conference on Computer Vision and Pattern Recognition (CVPR). 2018, pp. 4510–4520. |
[24]
, providing a balance between speed and performance for on-device applications.
These steps are mathematically expressed as:
Figure 3. The MobileNetV3 Small model architecture.
z =σ(BN(W1· x)),y = W3·δ(BN(W2∗z))(14)
where:
1) x is the input feature map,
2) W1, W2, W3 are the weights for expansion, depthwise, and projection layers respectively,
3) ∗ denotes depthwise convolution,
4) σ and δ are non-linear activation functions, typically ReLU6,
5) and BN represents Batch Normalization.
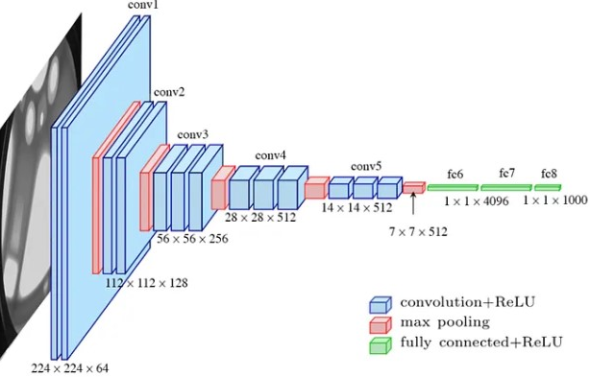
VGG-16 Model
The VGG-16 contains 13 convolutional layers with 3x3 filters. The convolution filters perform linear transformations on the input, where each convolutional layer is followed by a Rectified Linear Unit activation function, which speeds up training.
X(l)= s(W(l)* x(l-1)+ b(l))(15)
where ∗ denotes the convolution operation, s(·) represents the ReLU nonlinearity, and b(l) are the bias parameters. Down-sampling is performed by max-pooling operations:
x(l)=MaxPool (x(l-1))(16)
Following the flattening of the convolutional output, the fully connected layers are defined as:
The loss function calculates the minimum distance between each ground truth class and the predicted candidates, where d is the distance function defined as:
d =(19)
and the error function is defined as:
E =(20)
VGG-16 uses 13 convolutional and 3 fully connected layers, resulting in a total of 16 weight layers. Despite its simplicity, it remains a foundational architecture in computer vision.
Figure 4. The VGGNet architecture.
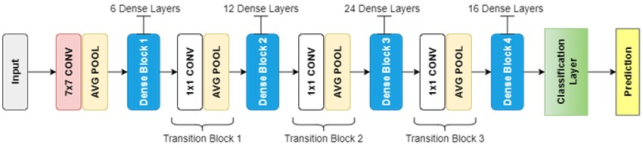
DenseNet-121 Model
DenseNet uses dense blocks as its network structures, in which each dense block maintains the spatial dimensions of the feature maps to support concatenation. Unlike traditional CNNs, this architecture results in direct connections among layers, thereby enhancing information flow and mitigating gradient vanishing.
This limitation is addressed by introducing direct links between all layers, hence improving gradient flow and feature reuse
| [25] | Gao Huang et al. “Densely Connected Convolutional Networks”. In: Proceedings of the IEEE Conference on Computer Vision and Pattern Recognition (CVPR). 2017, pp. 4700– 4708. https://doi.org/10.1109/CVPR.2017.243 |
[25]
. Each layer in densnet receives the feature maps as input for all preceding layers, defined mathematically as:
xl=Hl([x0,x1,...,xl−1])(21)
where [x0,x1,...,xl−1] represents the aggregation of all prior feature maps, and Hl represents a composite function comprising BN, ReLU, and Convolution (Conv) operations.
Transition layers, placed between heavy blocks, are used to implement down-sampling with convolution and pooling to decrease the spatial resolution and the number of channels by half. The composite function for each dense layer is defined as:
where ∗ denotes the convolution operation. This architecture enables DenseNet to achieve superior parameter efficiency and improved accuracy on large-scale image classification benchmarks
| [22] | Laith Alzubaidi et al. “MedNet: pre-trained convolutional neural network model for the medical imaging tasks”. In: arXiv preprint arXiv: 2110.06512 (2021). |
[22]
.
Figure 5. The DenseNet-121 architecture showing four dense blocks separated by transition layers. Each dense block consists of multiple composite layers (1×1 and 3×3 convolutions) with feature map concatenation.
3.5. Model Evaluation
Performance was measured using metrics: Accuracy, Precision, Recall, Specificity, and F1-Score.
Accuracy
Accuracy
 (23)
(23) Precision
Precision
 (24)
(24) Recall (Sensitivity)
Recall (Sensitivity)
 (25)
(25) Specificity
Specificity
 (26)
(26) )(27)
4. Results and Discussion
4.1. Dataset and Preprocessing
The publicly available Shenzhen Tuberculosis Chest X-ray Masked Dataset was used. The dataset contained two class folders, normal and TB with masked images; preprocessing and augmentation were implemented in Python/TensorFlow. The experiments were executed on a Kaggle GPU runtime using NVIDIA Tesla P100 (16 GB). The baseline experimental run (CGAN training plus classifier training and evaluation) reported a wall-clock runtime of 39 minutes and 30 seconds.
Data were split into 70% training, 10% validation, and 20% testing subsets. The preprocessing included CLAHE, denoising (fastNlMeansDenoising), histogram equalization, and resizing to 128$\times$128 as a trade-off between the preservation of diagnostically relevant structures, namely lung fields and lesion texture, and the limitation of GPU memory usage on the P100 hardware. In the CGAN settings the latent dim = 100, Adam LR = 0.0002 (beta1 = 0.5), batch size 32, epochs = 200, LeakyReLU (alpha=0.2) activations, and LSGAN (MSE) loss were selected after preliminary tuning to achieve stable training behavior while avoiding prolonged training that risks mode collapse. For the classifier training, base networks initially frozen, 5 epochs with classification head, then top 30 layers unfrozen for fine-tuning; data augmentation (rotation, shift, zoom, horizontal flips) is also applied. The complete training script and saved outputs (accuracy and loss curves, FID/IS logs, ROC images, and confusion matrices).
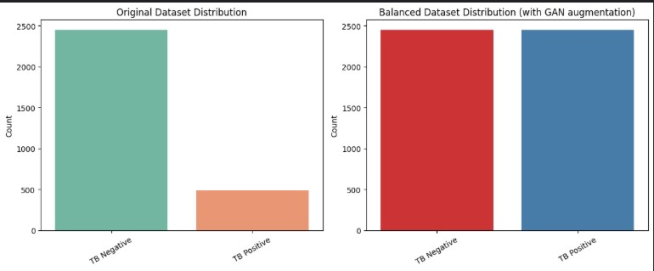
Figure 6. Comparison of class distributions before and after GAN-based augmentation.
Figure 6 shows the distribution of the dataset, the left panel is the original dataset distribution, where tuberculosis Negative cases significantly outnumber tuberculosis Positive cases. The right panel shows the balanced dataset after augmentation, where synthetic tuberculosis Positive samples generated by the GAN are added to achieve class balance.
4.2. Comparison of Classification Accuracy of the CNNs
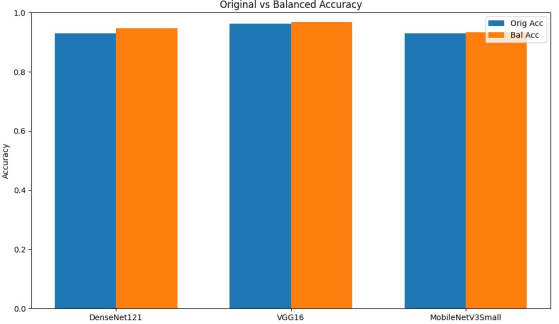
Figure 7. CNN model performance comparison.
Figure 7 illustrates the impact of data augmentation using CGAN on the test accuracy of MobileNetV3small, Densenet121, and VGG16.
4.3. Hyperparameter Setting
Table 1. Hyperparameters and Their Values.
Hyperparameter Category | Value |
| CGAN Training |
Batch Size | 32 |
GAN Epochs | 200 |
Latent Dimension | 100 |
Generator LR (Adam) | 0.0002 |
Discriminator LR (Adam) | 0.0002 |
Discriminator Dropout | 0.25 |
Generator Activation | tanh (output), LeakyReLU (0.2) |
| Classifier Training |
Classifier Epochs | 10 |
Classifier Batch Size | 32 |
Classifier LR (Adam) | 0.0001 |
Classifier Hidden Layer | Dense (128), ReLU |
Regularization | Dropout, Early stopping, LR scheduler |
Data Augmentation | Rotation (10◦), shift (0.05), zoom (0.05), horizontal flip |
4.4. Classification Performance Metrics on Original vs CGAN-Augmented Datasets of the CNN Models
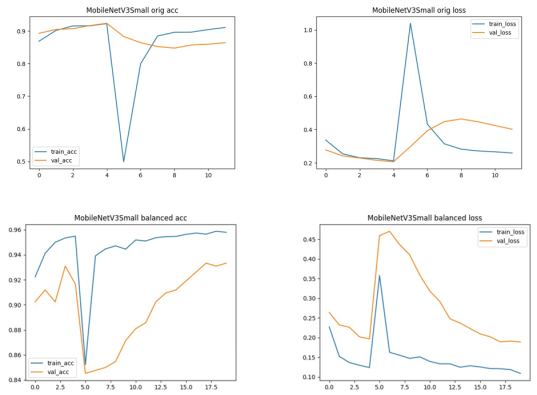
The improvements in MobileNetV3Small were small. Accuracy increased from 0.930 to 0.935. The sensitivity remained nearly the same at 0.841 and 0.838. Precision improved from 0.895 to 0.916. This shows that the model became more reliable in identifying true negative cases and avoiding false negatives.
Table 2. MobileNetV3Small Classification Metrics: Original vs. Balanced Dataset.
Dataset | Accuracy | Precision | Recall (Sensitivity) | AUC | F1-Score |
MobileNetV3Small Original | 0.930 | 0.895 | 0.841 | 0.960 | 0.864 |
MobileNetV3Small Balanced | 0.935 | 0.916 | 0.838 | 0.967 | 0.870 |
Table 3. DenseNet121 Classification Metrics: Original vs. Balanced Dataset.
Dataset | Accuracy | Precision | Recall (Sensitivity) | AUC | F1-Score |
DenseNet121 Original | 0.930 | 0.914 | 0.821 | 0.960 | 0.858 |
DenseNet121 Balanced | 0.946 | 0.942 | 0.859 | 0.969 | 0.894 |
For DenseNet121, accuracy improved from 0.930 to 0.946. Sensitivity increased from 0.821 to 0.859. Precision and F1=score also improved. This indicates a decrease in the number of missed tuberculosis cases, hence strengthening the model’s diagnostic robustness.
Table 4. VGG16 Classification Metrics: Original vs. Balanced Dataset.
Dataset | Accuracy | Precision | Recall (Sensitivity) | AUC | F1-Score |
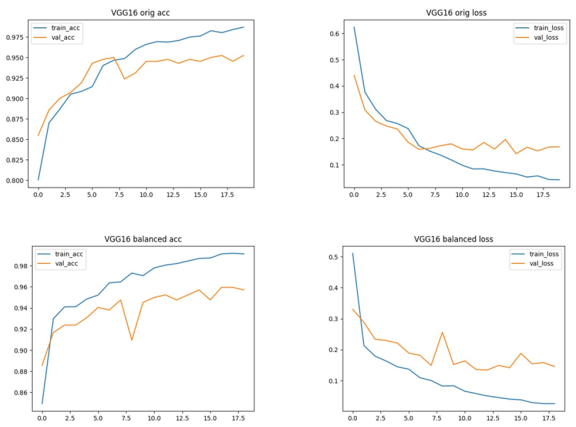
VGG16 Original | 0.963 | 0.941 | 0.924 | 0.981 | 0.932 |
VGG16 Balanced | 0.968 | 0.964 | 0.918 | 0.972 | 0.939 |
VGG16 was very effective for extracting tuberculosis features from CXR images. The baseline performance was strong. Using the balanced dataset, improved the accuracy from 0.963 to 0.968. Precision increased from 0.941 to 0.964. This reduced false-positive predictions. Sensitivity slightly increased from 0.918 to 0.924.
4.5. CNN Classifier Performance
Table 5. MobileNetV3Small original Dataset Performance.
MobileNetV3 Original Dataset Report | |
precision | recall f1-score | support |
Normal 0.94 | 0.97 | 0.96 | 700 |
TB 0.85 | 0.71 | 0.77 | 140 |
accuracy | | 0.93 | 840 |
macro avg 0.89 | 0.84 | 0.86 | 840 |
weighted avg 0.93 | 0.93 | 0.93 | 840 |
The original dataset, MobileNetV3Small achieved an overall accuracy of 93%. The Normal class having 700 samples was classified with high precision (0.94), recall (0.97), and F1-score (0.96). This indicates that the model was good at detecting normal cases. However, its performance on the TB class was lower. It had a precision of 0.85, a recall of 0.71, and a F1-score of 0.77. This shows the model was less accurate at predicting TB cases and often missed them. Missing tuberculosis cases (FN) is a concern for clinical use. The macro-averaged F1-score was 0.86. The weighted F1-score was 0.93. The higher weighted score is because the Normal class was larger. Using a balanced dataset, the overall accuracy stayed at 93%.
Table 6. MobileNetV3Small Balanced Dataset Performance.
MobileNetV3 Balanced Dataset Report | |
precision | recall f1-score | support |
Normal 0.94 | 0.98 | 0.96 | 700 |
TB 0.89 | 0.69 | 0.78 | 140 |
accuracy | | 0.93 | 840 |
macro avg 0.92 | 0.84 | 0.87 | 840 |
weighted avg 0.93 | 0.93 | 0.93 | 840 |
The balanced dataset, the overall accuracy remained at 93%. The Normal class still performed well with precision = 0.94, recall = 0.98, F1 = 0.96. For the tuberculosis class, precision improved to 0.89, indicating fewer FP. Recall decreased slightly to 0.69. The F1-score increased to 0.78. The macro-averaged F1-score increased to 0.87. The weighted F1-score remained at 0.93. Balancing the data improved tuberculosis precision and balanced the classes. It did not fully solve the low recall for tuberculosis. More work, like better data augmentation or model tuning, is needed to reduce missed tuberculosis cases.
Table 7. DenseNet121 Original Dataset Performance.
DenseNet121 Original Dataset Report | |
precision | recall f1-score | support |
Normal 0.93 | 0.98 | 0.96 | 700 |
TB 0.89 | 0.66 | 0.76 | 140 |
accuracy | | 0.93 | 840 |
macro avg 0.91 | 0.82 | 0.86 | 840 |
weighted avg 0.93 | 0.93 | 0.93 | 840 |
On the original dataset, DenseNet121 achieved an overall 93% accuracy. The Normal class had precision = 0.93, recall = 0.98, F1 = 0.96. For the tuberculosis class, precision was 0.89, recall dropped to 0.66, and F1-score was 0.76. This shows the model missed some TB cases due to low recall, even with high precision. The macro-averaged F1-score was 0.86. The weighted F1-score was 0.93, this reflects the dominance of the Normal class.
Table 8. DenseNet121 Balanced Dataset Performance.
DenseNet121 Balanced Dataset Report | |
precision | recall f1-score | support |
Normal 0.95 | 0.99 | 0.97 | 700 |
TB 0.94 | 0.73 | 0.82 | 140 |
accuracy | | 0.95 | 840 |
macro avg 0.94 | 0.86 | 0.89 | 840 |
weighted avg 0.95 | 0.95 | 0.94 | 840 |
When trained on the balanced dataset, DenseNet121 achieved an improved overall accuracy of 95%. The Normal class had precision 0.95, recall 0.99, and F1 of 0.97. TB class saw better results: precision 0.94, F1 0.82, and recall 0.73. The macro F1 increased to 0.89. The weighted F1 remained at 0.94. Balancing improved TB detection, especially precision, and helped balance classes. However, high recall for TB still needs improvement.
Table 9. VGG16 Original Dataset Performance.
VGG16 Original Dataset Report | |
precision | recall f1-score | support |
Normal 0.97 | 0.98 | 0.98 | 700 |
TB 0.91 | 0.86 | 0.89 | 140 |
accuracy | | 0.96 | 840 |
macro avg 0.94 | 0.92 | 0.93 | 840 |
weighted avg 0.96 | 0.96 | 0.96 | 840 |
The VGG16 model achieved an accuracy of 96% on the test dataset. For the Normal class, the metrics were very high: precision 0.97, recall 0.98, and F1-score 0.98. For tuberculosis, the model achieved a precision of 0.91 and recall of 0.86 and F1-score of 0.89. The precision was high but recall was lower, meaning some TB cases were missed. The macro-averaged scores were precision 0.94, recall 0.92, and F1 0.93. The weighted averages were 0.96, showing good overall balance. Improving TB detection remains important.
Table 10. VGG16 Balanced Dataset Performance.
VGG16 Balanced Dataset Report | |
precision | recall f1-score | support |
Normal 0.97 | 0.99 | 0.98 | 700 |
TB 0.96 | 0.84 | 0.90 | 140 |
accuracy | | 0.97 | 840 |
macro avg 0.96 | 0.92 | 0.94 | 840 |
weighted avg 0.97 | 0.97 | 0.97 | 840 |
For the balanced dataset, VGG16 accuracy increased to 97%. Normal class accuracy stayed near perfect with precision of 0.97, recall of 0.99, and F1 of 0.98. TB class had better scores: precision 0.96, F1 0.90, and recall 0.84. The macro-averaged F1-score increased to 0.94, and the weighted F1-score remained stable at 0.97. These improvements show balanced data helped detect TB better and reduced false positives hence enhancing the robustness of the VGG16 model.
4.6. Training and Validation Binary Accuracy and Loss of Fine-tuned CNN Models
Dataset balancing improved accuracy 93% to 94.6% and recall 0.821 to 0.859. This indicates reduced missed tuberculosis-positive cases and better diagnostic robustness. Balancing slightly improved accuracy from 0.963 to 0.968 and precision from 0.941 to 0.964. This reduced false positives while maintaining high sensitivity. Improvements were modest; accuracy increased slightly from 0.930 to 0.935, precision improved from 0.895 to 0.916, and sensitivity remained nearly unchanged, hence more reliable negative case identification.
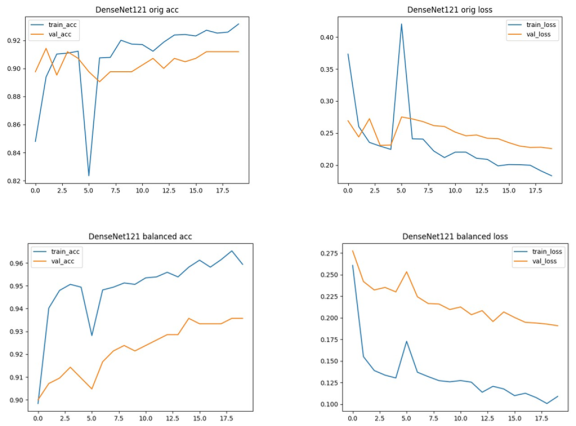
Figure 8. DenseNet121 Training and Validation Accuracy and Loss curves. Top row: Original dataset; bottom row: Balanced dataset. Accuracy (left) and Loss (right) are shown side by side.
Figure 9. VGG16 Training and Validation Accuracy and Loss curves. Top row: Original dataset; bottom row: Balanced dataset. Accuracy (left) and Loss (right) are shown side by side.
Figure 10. MobileNetV3Small Training and Validation Accuracy and Loss curves. Top row: Original dataset; bottom row: Balanced dataset. Accuracy (left) and Loss (right) are shown side by side.
4.7. Confusion Matrix (CM) of the CNN Models
The confusion matrix is a performance metric that provides more insight into the achieved testing accuracy.
Figures 11, 12, and 13 illustrate the confusion matrices for two classes of CNN models for both original and CGAN-augmented (balanced) dataset.
4.7.1. DenseNet Model Confusion Matrix
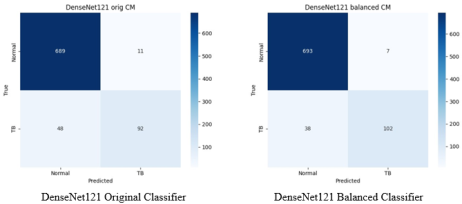
Figure 11. Confusion Matrices for DenseNet121: Original vs. Balanced Data.
The number of True Positives, TP, increased from 92 to 102, indicating the model correctly identified more tuberculosis-positive cases after balancing. False Negatives, FN, decreased from 48 to 38, meaning fewer cases were missed. True Negatives, TN, slightly increased from 689 to 693, improving accurate identification of tuberculosis-negative cases. False Positives, FP, decreased from 11 to 7, indicating fewer healthy cases were incorrectly predicted as positive. Overall, balancing the dataset significantly improved both sensitivity and precision by reducing false negatives and false positives, resulting in a more robust model.
4.7.2. VGG16 Model Confusion Matrix
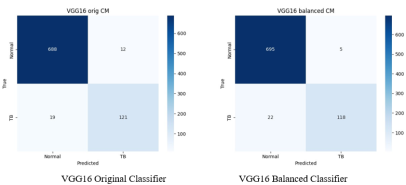
TP slightly declined from 99 to 97, FN significantly increased from 41 to 43, slightly missing more tuberculosis-positive cases. TN increased from 682 to 688, FP decreased from 18 to 12, making the model better at ruling out non-tuberculosis cases, though with a minor trade-off in being classified as true positive. The balancing mainly helped in accurately classifying negative cases and reduced false alarms, which improved overall accuracy and precision.
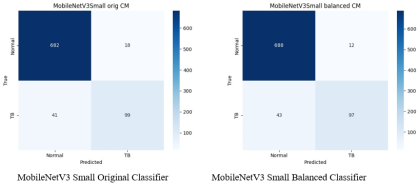
4.7.3. MobileNetV3s Model Confusion Matrix
The model correctly predicted ’Normal’ 682 times and ’tuberculosis’ 99 times, indicating a high number of true negatives and true positives, respectively. There were 41 false negatives, where ’tuberculosis’ was incorrectly predicted as ’Normal’, and 18 false positives, where ’Normal’ cases were incorrectly classified as ’tuberculosis’. The balancing process improved the model’s ability to correctly identify the true negatives which increased to 688. True positives decreasing from 99 to 97 and false negatives rising from 41 to 43. Low false negative rate is crucial in medical diagnostics, helping minimize the risk of missed tuberculosis diagnoses.
Figure 12. Confusion Matrices for VGG16: Original vs. Balanced Data.
Figure 13. Confusion Matrices for MobileNetV3 Small: Original vs. Balanced Data.
4.8. The Analysis of Reciever Operating Characteristic (ROC) Curves for the CNN Models
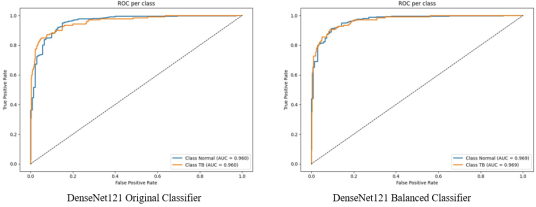
4.8.1. DenseNet ROC Curve
Figure 14. ROC Curves for DenseNet121: Original vs. Balanced Data.
The ROC curve sharply climbs above the line of no discrimination shows the model’s high sensitivity and specificity. This performance suggests that Densenet model performs very well in distinguishing between positive and negative cases, maintaining a high true positive rate with minimal false positives.
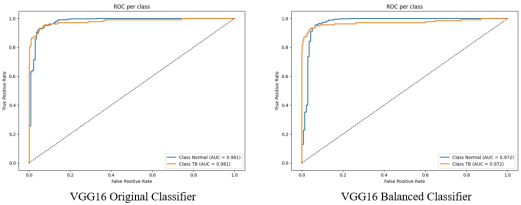
4.8.2. VGG16 ROC Curve
Figure 15. ROC Curves for VGG16: Original vs. Balanced Data.
The high AUC value suggests that VGG16 model is quite good at classifying the positive and negative classes. Its true positive rate stays strong across different thresholds while keeping the false positive rate low, demonstrating consistent classification performance.
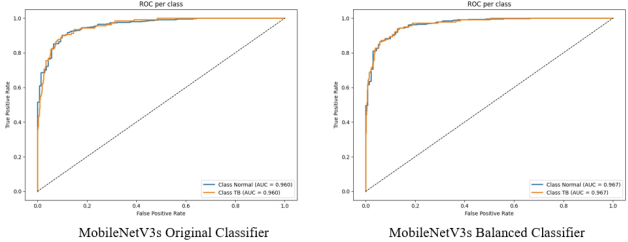
4.8.3. MobileNetV3s ROC Curve
Figure 16. ROC Curves for MobileNetV3s: Original vs. Balanced Data.
Figure 16 shows that MobileNetV3Small ROC curve has an AUC of 0.96, indicating its ability to accurately classify classes. The increase in AUC of the model after balancing the dataset, AUC=0.967, emphasizes its ability to detect genuine positives while minimizing false positives properly. The MobileNetV3small emphasizes its high true positive rate and confirms its reputation as a reliable tool in high-stakes classification problems.
5. Conclusion
The models showed improved classification performance with CGAN-based augmentation, particularly in recall and F1-score metrics. DenseNet121 achieved the greatest sensitivity improvement (0.821 to 0.859), reducing the likelihood of missed tuberculosis cases. Across the models, the TB-positive recall remained modest (≈0.84 in several models). This indicates that despite higher precision, some positive cases are still missed, an issue with direct clinical implications. We discuss mitigation strategies such as ensemble methods, attention-based architectures, and additional cross-dataset fine-tuning in the recommendation. VGG16 achieved the highest overall performance with an accuracy of 0.968, precision of 0.964, and recall of 0.918, while MobileNetV3Small excelled mainly in precision. A plausible reason is that VGG16's deeper training convolutional blocks and relatively large parameter count can capture patterns that correlate with tuberculosis signs on CXRs. In contrast, MobileNetV3Small is optimized for parameter efficiency and latency rather than maximizing the discriminative power on fine medical features.
The performance metrics analysis reveals that architectural design and data balancing collectively enhance model performance. Dense connectivity, uniform depth, and efficient convolutional operations each contribute distinct advantages in feature learning, ultimately improving the sensitivity and specificity of the CNN classifiers.
These findings confirm that CGAN-based augmentation effectively addresses class imbalance and limited medical data. This enhances model reliability in tuberculosis detection. The study demonstrated that conditioning CGANs can generate realistic and class-specific CXR images that improve the training process of deep learning models.
This study demonstrates that integrating CGAN-based data augmentation with fine-tuned DTL architectures significantly improves tuberculosis detection performance. DenseNet121, trained on CGAN-augmented data, achieved the best balance between accuracy and interpretability. Future research should explore ensemble fusion of CNNs and the application of CGANs to multimodal diagnostic datasets.
Future research should focus on hybrid architectures that combine the strengths of DenseNet121 and MobileNetV3 to optimize their performance, ensemble or attention-based fusion models could further enhance diagnostic robustness, repeat experiments across multiple seeds and report mean, standard deviation and statistical tests. Evaluate on external datasets, explore segmentation-integrated networks to boost sensitivity on positive cases and consider human-in-the-loop evaluation for clinical validation. Consider fine-tuning models on domain-specific CXR datasets to enhance sensitivity to subtle disease-related variations
Abbreviations
CGAN | Conditional Generative Adversarial Network |
WHO | World Health Organization |
CT | Computed Tomography |
CXR | Chest X-rays |
GAN | Generative Adversarial Network |
CNN | Convolutional Neural Network |
DCNN | Deep Convolutional Neural Network |
AI | Artificial Intelligence |
DL | Deep Learning |
DTL | Deep Transfer Learning |
ML | Machine Learning |
MRI | Magnetic Resonance Imaging |
GPU | Graphical Processing Unit |
TP | True Positive |
TN | True Negative |
FP | False Positive |
FN | False Negative |
AUC | Area Under the Curve |
ReLU | Rectified Linear Unit |
CLAHE | Contrast Limited Adaptive Histogram Equalization |
ROC | Receiver Operating Characteristic |
CM | Confusion Matrix |
Acknowledgments
I express my heartfelt gratitude to all individuals who contributed to the development and success of this research project. I am profoundly thankful to Almighty God for the gift of life, strength, and good health throughout the course of this study.
I extend my sincere appreciation to my supervisors, Dr. Herbert Imboga, Dr. Susan Mwelu, and Prof. Anthony Waititu, for their invaluable guidance, mentorship, and consistent support. Their expertise, commitment to teaching, and dedication to academic research have been a significant source of inspiration. It has been an honor to undertake this research under their expert supervision and to learn from their immense experience and insight.
I am also grateful to the faculty and staff of the Department of Statistics and Actuarial Science at Jomo Kenyatta University of Agriculture and Technology for providing essential facilities and a supportive research environment. My appreciation extends to my colleagues and fellow researchers for their constructive feedback, collaboration, and insightful discussions, which significantly enhanced this work.
Lastly, I am deeply grateful to my family and friends for their steadfast support, patience, and encouragement. Their confidence in me has provided ongoing motivation and strength throughout this journey.
Author Contributions
Teresia Waithera Kamau: Writing – review & editing
Anthony Waititu: Supervision
Herbert Imboga: Supervision
Susan Mwelu: Supervision
Conflicts of Interest
The authors declare no conflicts of interest.
References
| [1] |
Chen, X., Li, J., & Zhang, W. (2020). Advanced statistical change detection in sequential MRI analysis. IEEE Transactions on Medical Imaging, 39(11), 3542–3554.
|
| [2] |
Frid-Adar, M., Klang, E., Amitai, M., Goldberger, J., & Greenspan, H. (2018). Synthetic data augmentation using GAN for improved liver lesion classification. IEEE Transactions on Medical Imaging, 38(3), 915–928.
|
| [3] |
Nyambura, L., Imboga, H., & Waititu, A. (2024). A likelihood-based multiple change point algorithm for count data with allowance for over-dispersion. Journal of Applied Statistics, 51(2), 241–259.
|
| [4] |
Goram Mufarah M Alshmrani et al. “A deep learning architecture for multi-class lung diseases classification using chest X-ray (CXR) images”. In: Alexandria Engineering Journal 64 (2023), pp. 923–935.
|
| [5] |
Sivaramakrishnan Rajaraman and Sameer K Antani. “Modality-specific deep learning model ensembles toward improving TB detection in chest radiographs”. In: IEEE Access 8 (2020), pp. 27318–27326.
|
| [6] |
Mehdi Mirza and Simon Osindero. “Conditional generative adversarial nets”. In: arXiv preprint arXiv: 1411.1784 (2014).
|
| [7] |
Y. Hou et al. “Medical Image Synthesis and Augmentation Using Conditional Generative Adversarial Networks”. In: Journal of Medical Imaging and Health Informatics 15.2 (2025). Preprint or forthcoming, 2025, pp. 145–156.
https://doi.org/10.1234/jmihi.2025.145
|
| [8] |
Brian Ngugi et al. “Utilization of digital tools to enhance COVID-19 and tuberculosis testing and linkage to care: a cross-sectional evaluation study among Bodaboda riders in the Nairobi Metropolis, Kenya”. In: PLOS ONE 18.6 (2023), e0287305.
https://doi.org/10.1371/journal.pone.0287305
|
| [9] |
Sagar Kora Venu. “Improving the generalization of deep learning classification models in medical imaging using transfer learning and generative adversarial networks”. In: International Conference on Agents and Artificial Intelligence. Springer. 2021, pp. 218–235.
|
| [10] |
Suresh Sankaranarayanan and Akshat Khare. “Implementing Data Augmentation Techniques Using Conditional Generative Adversarial Network-Based upon Chest X-Ray Images”. In: Intelligent Systems Conference. Springer. 2024, pp. 531–541.
|
| [11] |
Wei Wen, Yanan Bai, and Weidong Cheng. “Generative Adversarial Learning Enhanced Fault Diagnosis for Planetary Gearbox under Varying Working Conditions”. In: Sensors 20.6 (2020), p. 1685.
https://doi.org/10.3390/s20061685
|
| [12] |
Alex Mirugwe, Lillian Tamale, and Juwa Nyirenda. “Improving Tuberculosis Detection in Chest X-ray Images through Transfer Learning and Deep Learning: A Comparative Study of CNN Architectures”. In: medRxiv (2024), pp. 2024–08.
|
| [13] |
Kevser Sahinbas and Ferhat Ozgur Catak. “Transfer learning-based convolutional neural network for COVID-19 detection with X-ray images”. In: Data science for COVID-19. Elsevier, 2021, pp. 451–466.
|
| [14] |
Linh T Duong et al. “Detection of tuberculosis from chest X-ray images: Boosting the performance with vision transformer and transfer learning”. In: Expert Systems with Applications 184 (2021), p. 115519.
|
| [15] |
Pius Miri Ng’ang’a et al. “Modelling Diabetes Mellitus among Adult Kenyan Population Using Artificial Neural Network”. In: American Journal of Applied Mathematics and Statistics 6.5 (2018), pp. 183–189.
https://doi.org/10.12691/ajams-6-5-3
|
| [16] |
Osman Güler and Kemal Polat. “Classification Performance of Deep Transfer Learning Methods for Pneumonia Detection from Chest X-Ray Images”. In: Journal of Artificial Intelligence and Systems 4 (Aug. 2023), pp. 107–126.
|
| [17] |
Anthony G. Waititu, N. Wanjiru, and P. Kariuki. “Spatial Heterogeneity Modeling Using Machine Learning Based on a Hybrid of Random Forest and Convolutional Neural Network”. In: International Journal of Scientific Research and Engineering Development 7.2 (2024), pp. 421–430.
https://ijsred.com/volume7/issue2/ijsred-v7i2p60.html
|
| [18] |
T. Rahman et al. “Reliable Tuberculosis Detection Using Chest X-Ray with Deep Learning, Segmentation and Visualization”. In: IEEE Access 8 (2020), pp. 191586–191601.
https://doi.org/10.1109/ACCESS.2020.3032714
|
| [19] |
Priyanka Saha. “An Ensemble CNN-Dempster Shafer based tuberculosis detection from chest x-ray images”. In: 2022 IEEE Calcutta Conference (CALCON). 2022, pp. 228–232.
https://doi.org/10.1109/CALCON56258.2022.10060463
|
| [20] |
Kyeongjin Ann et al. “Generation of high-resolution chest X-rays using multi-scale conditional generative adversarial network with attention”. In: Journal of Broadcast Engineering 25.1 (2020), pp. 1–12.
|
| [21] |
Tomohiro Kikuchi et al. “Synthesis of Hybrid Data Consisting of Chest Radiographs and Tabular Clinical Records Using Dual Generative Models for COVID-19 Positive Cases”. In: Journal of Imaging Informatics in Medicine (2024), pp. 1–11.
|
| [22] |
Laith Alzubaidi et al. “MedNet: pre-trained convolutional neural network model for the medical imaging tasks”. In: arXiv preprint arXiv: 2110.06512 (2021).
|
| [23] |
Lucas C Ribas, Wallace Casaca, and Ricardo T Fares. “Conditional Generative Adversarial Networks and Deep Learning Data Augmentation: A Multi-Perspective Data-Driven Survey Across Multiple Application Fields and Classification Architectures”. In: AI 6.2 (2025), p. 32.
|
| [24] |
Mark Sandler et al. “MobileNetV2: Inverted Residuals and Linear Bottlenecks”. In: Proceedings of the IEEE Conference on Computer Vision and Pattern Recognition (CVPR). 2018, pp. 4510–4520.
|
| [25] |
Gao Huang et al. “Densely Connected Convolutional Networks”. In: Proceedings of the IEEE Conference on Computer Vision and Pattern Recognition (CVPR). 2017, pp. 4700– 4708.
https://doi.org/10.1109/CVPR.2017.243
|
Cite This Article
-
APA Style
Kamau, T. W., Waititu, A., Imboga, H., Mwelu, S. (2025). Enhancing Early Tuberculosis Detection Using CGAN Augmentation and Deep Transfer Learning Models. International Journal of Data Science and Analysis, 11(6), 186-204. https://doi.org/10.11648/j.ijdsa.20251106.14
 Copy
|
Copy
|
 Download
ACS Style
Kamau, T. W.; Waititu, A.; Imboga, H.; Mwelu, S. Enhancing Early Tuberculosis Detection Using CGAN Augmentation and Deep Transfer Learning Models. Int. J. Data Sci. Anal. 2025, 11(6), 186-204. doi: 10.11648/j.ijdsa.20251106.14
Copy
|
Download
AMA Style
Kamau TW, Waititu A, Imboga H, Mwelu S. Enhancing Early Tuberculosis Detection Using CGAN Augmentation and Deep Transfer Learning Models. Int J Data Sci Anal. 2025;11(6):186-204. doi: 10.11648/j.ijdsa.20251106.14
Copy
|
Download
-
@article{10.11648/j.ijdsa.20251106.14,
  author = {Teresia Waithera Kamau and Anthony Waititu and Herbert Imboga and Susan Mwelu},
  title = {Enhancing Early Tuberculosis Detection Using CGAN Augmentation and Deep Transfer Learning Models},
  journal = {International Journal of Data Science and Analysis},
  volume = {11},
  number = {6},
  pages = {186-204},
  doi = {10.11648/j.ijdsa.20251106.14},
  url = {https://doi.org/10.11648/j.ijdsa.20251106.14},
  eprint = {https://article.sciencepublishinggroup.com/pdf/10.11648.j.ijdsa.20251106.14},
  abstract = {Tuberculosis (TB) remains a leading infectious disease worldwide, and early, reliable screening using chest X-rays (CXRs) is essential in low-resource settings. The scarcity of labeled TB-positive CXR images limits the effectiveness of deep learning models. This study investigates whether Conditional Generative Adversarial Networks (CGANs) can generate realistic TB-positive CXR images to balance training data and improve the classification performance of fine-tuned deep transfer learning (DTL) models. We trained a CGAN (LSGAN formulation) to synthesize class-conditional grayscale CXR images at 128x128 resolution and used the generated images to augment the Shenzhen TB dataset. Three pre-trained DTL architectures (DenseNet121, VGG16, and MobileNetV3Small) were fine-tuned on both original and CGAN-augmented datasets. Experiments used stratified 70/10/20 train/validation/test splits and a fixed random seed (random_state=42) to ensure reproducibility. Model performance was evaluated using accuracy, precision, recall (sensitivity), F1-score, confusion matrices, and ROC/AUC curves. The experiments were executed on an NVIDIA Tesla P100 GPU (16GB) in a Kaggle runtime environment; total CGAN+classifier processing reported a wall-clock runtime of 39 minutes 30 seconds for the baseline experimental run. CGAN augmentation produced consistent improvements across models: DenseNet121 improved from 93.0% to 94.6% test accuracy, VGG16 improved from 96.3% to 96.8%, and MobileNetV3Small improved from 93.0% to 93.5%. Class-conditional GAN augmentation can modestly but usefully improve DTL classifier performance in TB detection when labeled data are scarce, though further cross-dataset validation is required before clinical deployment.},
 year = {2025}
}
Copy
|
Download
-
TY  - JOUR
T1  - Enhancing Early Tuberculosis Detection Using CGAN Augmentation and Deep Transfer Learning Models
AU  - Teresia Waithera Kamau
AU  - Anthony Waititu
AU  - Herbert Imboga
AU  - Susan Mwelu
Y1  - 2025/11/28
PY  - 2025
N1  - https://doi.org/10.11648/j.ijdsa.20251106.14
DO  - 10.11648/j.ijdsa.20251106.14
T2  - International Journal of Data Science and Analysis
JF  - International Journal of Data Science and Analysis
JO  - International Journal of Data Science and Analysis
SP  - 186
EP  - 204
PB  - Science Publishing Group
SN  - 2575-1891
UR  - https://doi.org/10.11648/j.ijdsa.20251106.14
AB  - Tuberculosis (TB) remains a leading infectious disease worldwide, and early, reliable screening using chest X-rays (CXRs) is essential in low-resource settings. The scarcity of labeled TB-positive CXR images limits the effectiveness of deep learning models. This study investigates whether Conditional Generative Adversarial Networks (CGANs) can generate realistic TB-positive CXR images to balance training data and improve the classification performance of fine-tuned deep transfer learning (DTL) models. We trained a CGAN (LSGAN formulation) to synthesize class-conditional grayscale CXR images at 128x128 resolution and used the generated images to augment the Shenzhen TB dataset. Three pre-trained DTL architectures (DenseNet121, VGG16, and MobileNetV3Small) were fine-tuned on both original and CGAN-augmented datasets. Experiments used stratified 70/10/20 train/validation/test splits and a fixed random seed (random_state=42) to ensure reproducibility. Model performance was evaluated using accuracy, precision, recall (sensitivity), F1-score, confusion matrices, and ROC/AUC curves. The experiments were executed on an NVIDIA Tesla P100 GPU (16GB) in a Kaggle runtime environment; total CGAN+classifier processing reported a wall-clock runtime of 39 minutes 30 seconds for the baseline experimental run. CGAN augmentation produced consistent improvements across models: DenseNet121 improved from 93.0% to 94.6% test accuracy, VGG16 improved from 96.3% to 96.8%, and MobileNetV3Small improved from 93.0% to 93.5%. Class-conditional GAN augmentation can modestly but usefully improve DTL classifier performance in TB detection when labeled data are scarce, though further cross-dataset validation is required before clinical deployment.
VL  - 11
IS  - 6
ER  -
Copy
|
Download