Research Article | | Peer-Reviewed

Modeling the Climate-Conflict-Migration Interplay in Sudan by Integrating GAMS and Spatio-Temporal Neural Networks

Received: 22 April 2025     Accepted: 7 May 2025     Published: 16 June 2025
Views:       Downloads:
Abstract

The ongoing humanitarian crises in Sudan, which are being exacerbated by escalating climate change, persistent conflict, and migratory waves, highlight the critical need for predictive, data-driven models to guide efficient response plans. In order to investigate and predict the intricate links between climate variability, conflict intensity, and migration patterns in Sudan at the subnational level, this study combines Spatio-Temporal Neural Networks (STNNs) with Generalized Additive Models (GAMs). The hybrid modeling framework provides strong insights into displacement patterns and conflict dynamics by capturing both spatial-temporal dependencies and nonlinear effects. GAMs showed a high positive correlation between conflict severity and precipitation levels, as well as statistically significant nonlinear relationships between food prices and relocation. In the meantime, the STNNs performed better than traditional modeling techniques, with R2 values of 0.89 and 0.84 for conflict intensity and regional displacement prediction, respectively. These excellent performance measures show how well the model captures real-world dynamics and provide a useful tool for humanitarian predictions. Prototype app for visualizing migration and conflict forecasts are included in the study, but they are still in the early stages of development. Future studies aim to improve operational utility and decision-making support in the field through real-time application. The results highlight how crucial it is for humanitarian research to combine machine learning and statistical modeling. This study offers practical insights that can enhance early warning systems, policymaking, and disaster preparedness in climate-vulnerable areas like Sudan by identifying important drivers of displacement and violence.

Published in International Journal of Data Science and Analysis (Volume 11, Issue 3)
DOI 10.11648/j.ijdsa.20251103.12
Page(s) 63-75
Creative Commons

This is an Open Access article, distributed under the terms of the Creative Commons Attribution 4.0 International License (http://creativecommons.org/licenses/by/4.0/), which permits unrestricted use, distribution and reproduction in any medium or format, provided the original work is properly cited.

Copyright

Copyright © The Author(s), 2025. Published by Science Publishing Group

Keywords

Climate Change, Conflict, Migration, Sudan, Machine Learning, Spatio-temporal Neural Networks, Humanitarian, Forecasting

1. Introduction
At the horn of Africa, Sudan is central at a growing humanitarian crisis. Large number of conflicts, huge migrations, and climate-induced calamities including droughts have occurred in the nation, leading to spreading of food insecurity . Over 8 million people have been displaced from Sudan as a result of climatic stress and conflict, making it the country with the biggest displacement issue in the world as at early 2025 .
Scholars interest in the relationship between migration, conflict, and climate change also known as the Climate-Conflict-Migration (CCM) nexus—has grown , Few research, especially in Africa, have looked at these correlations using sound, data-driven methodologies. A majority of current research mainly ignores important interdependencies by leaning mainly on the political or environmental aspects.
To close that gap, this research forecasts and quantifies the CCM dynamics in Sudan by combining Spatio-Temporal Neural Networks (STNNs) with Generalized Additive Mod- els (GAMs). This study supports targeted humanitarian actions and policy-making by improving the accuracy of displacement and conflict early warning through the use of both statistical and deep learning techniques.
2. Literature Review
According to recent studies, society tensions and resource limitations are worsened by climate stressors like drought and temperature anomalies, especially in fragile states like Sudan . Abel et al. claimed that environmental change is a major indirect cause of forced migration, frequently brought forth by war and economic downturn . Climatic forces push populations to migrate, especially into already high pressured areas and increase the likelihood of violence .
The intricate relationship between migration, conflict, and climate change in vulnerable states like Sudan was highlighted by recent work. Food insecurity and conflict dynamics were said to have been increasingly associated with climate variability and extreme weather occurrences. In order to explore this connection, Ubilava looked at how crop results were impacted by climate shocks, which in turn intensified postharvest conflict, particularly in rural economies that depended on seasonal rainfall . In Sudan, where agriculture is a major source of income, this dynamic was especially pertinent.
Additionally, displacement tracking data is essential for verifying model results. The International Organization for Migration estimated that more than nine million people were displaced in Sudan in 2024 alone, with many pointing to conflict and environmental deterioration as the main reasons . Theoretical claims of links between climate change, migration, and war are supported by this operational evidence.
Institutional viewpoints provide even more nuance. According to the Africa Institute on Internal Displacements [AFIID], climate change has exacerbated humanitarian crises and overburdened response systems, making it a major driver of displacement throughout Africa . The paper promotes integrated adaptation solutions that combine conflict avoidance, migratory governance, and environmental policy.
Although there are numbers of empirical studies, the majority use linear regression or logistic or methods, which might not adequately capture the spatiotemporal and nonlinear aspects of the CCM nexus. For example, Conte et al. linked environmental variables with conflict incidence using multivariate regression, but they failed to take spatial aspect into consideration . The study by Mark and Naureen, published by MDPI, explored machine learning classification algorithms application forecast civil con- flict in Sub-Saharan Africa. It focused on numerous supervised learning models such as gradient tree boosting and multilayer perceptron, aiming to predict conflict events based on socioeconomic, political, and environmental variables .
The International Centre for Migration Policy Development examined the Khartoum Process from the standpoint of regional policy, outlining the lessons learned about migration governance in the face of political and environmental unrest in the Horn of Africa . By bridging data and policy gaps, the paper emphasized the importance of early interventions in patterns of migration brought on by climate change. Additionally, Ali examined how Sudan's wartime circumstances compromise its ability to adapt to climate change, contending that in order to prevent resource-based violence and cyclical displacement, peacebuilding and climate resilience must be given equal priority .
A solution is provided by Generalized Additive Models (GAMs), that enables adapt- able, non-parametric fits to nonlinear correlations between displacement and covariates including conflict intensity, food prices, and precipitation. Friedman’s research demonstrated the effectiveness of GAMs in social and climatic modeling .
By using machine learning to predict pastoral conflicts throughout Central Africa, Solaa et al. provided insightful methodological information that could help Sudan's subnational early warning systems . Their model combined temporal and geospatial data, which is a strategy that works well with Spatio-Temporal Neural Networks (STNNs). Bertetti et al. expanded on this by demonstrating that adding conflict data to food security models significantly increases forecast accuracy, highlighting the need of interdisciplinary integration in humanitarian crisis modeling .
Spatio-temporal neural networks (STNNs), one of the recent developments in deep learn- ing, offer strong instruments for simulating high-dimension systems. According to Berkani et al. , STNNs are superior to conventional models in the capture of temporal in- terdependence and geographical autocorrelation, perfecting them for forecasting patterns of migration and conflict .
3. Materials and Methods
Sudan, a nation in northern Africa that is badly impacted by economic instability, internal warfare, and environmental deterioration, is the subject of the study. This study examines the ways in which conflict interacts with socioeconomic and climatic factors to affect migration trends at the subnational level.
Data came from the World Bank for economic variables that included food prices from world food programme, the GDELT Project (Goldstein Score) for conflict intensity, and the (HDX) Humanitarian Data Exchange for migration and climate.
3.1. Generalized Additive Model (GAM) Specification
Intoduction
The research used Generalized Additive Models (GAMs) to study the non-linear impacts of socioeconomic, climatic, and conflict-related factors on migration and conflict intensity. To capture intricate patterns over time and space, the GAM framework provides each predictor with a smoothing function.
Goldenstein Score Terminology note
The Global Database of Events, Language, and Tone (GDELT) provides the Goldstein score, which is a continuous measure with a range of -10 to +10. It measures the tone and intensity of conflict occurrences that are recorded; higher conflict severity is indicated by more negative values, whereas cooperation or peaceful events are represented bypositive values.
Migration Rate Model
Migration Rate =β0+f1(Climate Factors)+f2(External Factors)+f3(Conflict Variable)+ϵ(1)
Conflict Intensity Model
Conflict Intensity =β0+f1(Climate Factors) +f2(External Factors) +ϵ(2)
Definitions:
1. Climate Factors: Precipitation and temperature.
2. External Factors: prices in Food.
3. Conflict Variable: Conflict Severity Score (Goldenstein score) (e.g., 10 = no con- flict, 9 = low conflict etc.).
4. f1, f2, f3: Non-parametric smoothing functions that estimate each covariate’s effect.
5. β0: Intercept term.
6. ϵ: Error term.
The number of monthly migrated persons is referred to as the migration rate. Both individual and combined contributions of economic, climatic, and conflict-related factors to observable migration and conflict patterns are studied with these models. Because of their adaptive nature, GAMs are used to find both linear and nonlinear correlations, typical in complex humanitarian contexts like Sudan.
Model Diagnostics
A framework for examining intricate systems, such the relationship between climate change, conflict, and migration (CCM), is offered by generalized additive models, or GAMs. They are helpful for investigating the non-linear and interacting effects of sev- eral variables, such as socioeconomic conditions (e.g., food prices), conflict intensity, and climate indicators (e.g., precipitation).
While conflict data can be continuous, categorical, or ordinal, climatic data is frequently continuous. GAMs are good at handling these dynamic data types. By estimating smooth functions across predictors, they are able to identify subtle patterns that traditional linear models might overlook.
Important model diagnostics consist of:
1. p-values: These show each smooth term’s statistical relevance for identifying the main drivers of migration and conflict.
2. gam.check() used to examine for residual patterns, overfitting, convergence prob- lems, and model appropriateness.
3. Deviance and Pseudo-R2 evaluates the model’s data fitness; results nearer 1 signify more explanatory power.
4. The AIC, or Akaike Information Criterion, is as follows: Better fit is generally indicated by lower AIC values, particularly when comparing various sets of variables or predictors in a model.
3.2. SpatioTemporal Neural Networks (STNN)
SpatioTemporal Neural Networks (STNN) merge spatial and temporal encoding to model processes such as climate-induced migration and conflict. The architecture integrates graph-based spatial dependencies together with recurrent models for temporal trends.
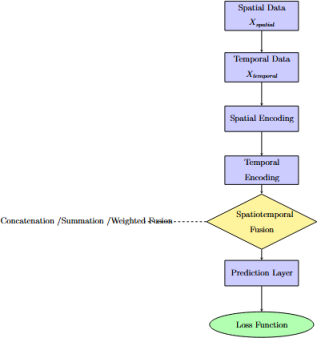
Figure 1. SpatioTemporal Neural Network Framework.
3.2.1. Spatial Data Representation
Let the input spatial data at time t be:
Xₛₚₐₜᵢₐₗ= { xₜⁱ}ⁿᵢ₌₁(3)
where xt RD is the feature vector for the i-th region (e.g., latitude, longitude) and n is the regions number.
3.2.2. Spatial Encoding
A graph-based structure is used in spatial relationship aspects encoding. Each region is represented as a node, and edges are defined using a matrix that is adjacent A. The spatial embedding for region i at time t is calculated as:
hₛₚₐₜᵢₐₗ(t) = GNN(xₜ, A)(4)
GNN denotes a Graph Neural Network that integrates spatial aspect from regions that are neighboring.
3.2.3. Temporal Data Representation
Temporal features such as precipitation and temperature for each region i at time t are represented as:
Xₜₑₘₚₒᵣₐₗ,ₜ= { zₜ}ⁿᵢ₌₁(5)
where:
zt∈RM
and M is the number of temporal variables.
3.2.4. Temporal Encoding
To capture sequence dependencies, the temporal data is passed through a Recurrent Neural Network (RNN). The temporal embedding for region n at time t is:
hₜₑₘₚₒᵣₐₗ(t) = RNN(zₜ)(6)
3.2.5. Spatio Temporal Fusion
The fused embedding adds spatial and temporal representations to form a unified feature:
hₛₚₐₜᵢₒₜₑₘₚₒᵣₐₗ(t) = f₍fᵤₛᵢₒₙ₎(hₛₚₐₜᵢₐₗ(t), hₜₑₘₚₒᵣₐₗ(t))(7)
The fusion function aspect ffusion can be implemented by use of element-wise summation or weighted concatenation.
3.2.6. Prediction Layer
The model predicts the output variable (e.g., migration rate, conflict intensity) for region i at time t + 1 using a fully connected prediction layer:
ŷₜ₊₁=σ(Wₒᵤₜ·hₛₚₐₜᵢₒₜₑₘₚₒᵣₐₗ(t) + bₒᵤₜ)(8)
where Wout and bout are learnable parameters and σ is an activation function (e.g., ReLU).
3.2.7. Training and Optimization
The model is trained towards loss reduction between actual and predicted values. Key optimization strategies include:
1. Adam Optimizer: Great for huge datasets and deep networks because of its adaptive learning rate adjustment.
2. Training Parameters:Batch size, Learning rates and epoch number are fine tuned for convergence.
3.2.8. Model Evaluation
The model’s performance is checked by using the coefficient of determination (R2):
R2=1-Σ(Yᵣᵤₑ - Yᵣₑd)2Σ(Yᵣᵤₑ - Ȳ)2(9)
where Ytrue are the observed data values, Ypred the predicted data values, and Y¯ of observed values.
4. Results and Discussion
4.1. Model Diagnostics and Assumptions
To check the reliableness of the Generalized Additive Model (GAM), diagnostic plots were studied to evaluate if residuals complied with key assumptions. As shown in Figure 2, the residuals seemed to meet the main criteria for validity:
1. Constant variance (Homoscedasticity): Residuals are evenly spread and stable across all fitted values levels.
2. Normality: The residuals distribution approximated a normal curve which sup- ported the Gaussian error assumptions.
3. Independence: No pattern that is discernible was observed in the residual plots, it indicates random error distribution and no autocorrelation.
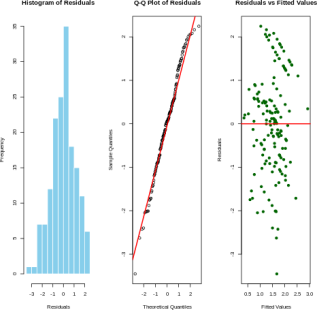
Figure 2. Residual diagnostics for the GAM model after transformation.
4.2. Displacement Modelling: GLM vs GAM Performance
Displacement trends were modeled first using a Generalized Linear Model (GLM), then further looked into using a more flexible Generalized Additive Model (GAM). Table 1 presents coefficient estimates from both models.
Table 1. Model Estimates: GLM and Full GAM.

Model

Variable

Coeff-Estimate

t-stat

p-value

GLM

Intercept

12.703

23.51

< 2 × 10-16

GLM

Price

-0.0019

-5.61

4.5 × 10⁸

GLM

Precipitation

0.190

1.30

0.194

GLM

Goldstein Score

-0.0138

-0.27

0.786

GAM

Intercept

-0.5013

-2.72

0.0104*

GAM

Precipitation

-0.2079

-0.93

0.359

In addition to parametric terms, the GAM includes smooth terms to capture non-linear relationships (Table 2).
Table 2. Smooth Effects in GAM Model.

Smooth Term

edf

Ref.df

F

p-value

s(Price)

1.00

1.00

4.88

0.0345*

s(Goldstein Score)

5.05

6.03

0.93

0.481

Model Comparison and Insights
Performance indicators showed that the full GAM outperforms the GLM:
1. GLM: AIC = 1775.7; Residual deviance = 5568.8; Adjusted R2 ≈ 0.10
2. Full GAM: AIC = 1708; Deviance explained = 30.7%; Adjusted R2 = 0.154
Although GAM showed a performance that is superior, the Precipitation and Goldstein Score effects were not statistically significant in both models.
Exploratory GAM: Price as Sole Predictor
With the consistency in statistical relevance of commodity price, a reduced GAM was made using only the Price variable. The summary statistics are shown in Table 3.
Table 3. Reduced GAM: Price Only.

Smooth Term

edf

Ref.df

F

p-value

s(Price)

4.575

5.553

19.92

< 2 × 10¹⁶

Metric

Value

Adjusted R2

0.266

Deviance Explained

27.7%

AIC

1706.96

Interpretation of Results
The strongest and most consistent driver of displacement was price. Major insights are:
1. GLM shows a negative linear relationship significance between price and displace- ment (p < 0.001).
2. The GAM makes a confirmation to its nonlinear nature by elaborating the relation- ship more flexibly.
3. Precipitation and conflict intensity, shown by Goldstein Scores, showed limited association.
Conclusion: In all configurations, price remains most interpretable predictor of dis- placement. The results imply that economic factors, mainly commodity pricing, have a more measurable impact on pattern movement than climate or conflict indicators in the dataset.
Threshold Plot and Interpretation
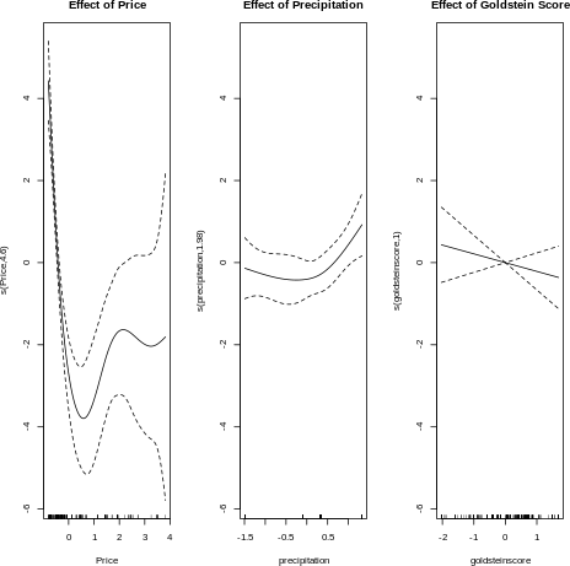
Figure 3. Threshold Plot.
The threshold plot (Figure 3) shows important changes in migration patterns based on environmental and economic conditions.
Wheat Price
1. Low prices ($81): Highest displacement, majorly due to market failing or income loss.
2. Moderate prices ($2500): Migration stabilizes as prices stabilize.
3. High prices ($4000): Displacement rises again, potentially signaling economic instability or pressures of inflation.
Rainfall
1. Low rainfall (0.5 mm): High displacement related to drought or failing crops.
2. Moderate rainfall (2.8–3.8 mm): Stable migration flows seen.
3. High rainfall (5.0 mm): A slight increase in displacement, due to flooding likely.
Conflict (Goldstein Score)
1. -10 Score: Highest displacement, indicating severity of conflict.
2. Neutral to +5 Scores: Reduced migration as conflict reduces.
3. +10 Score: Lowest displacement, associated with peace or aid help.
4.3. GAM (Conflict) Models and Interpretation
GAM Full Model
The full General Additive Model (GAM) shows that precipitation is a significant predictor of conflict. The table below provides the intricate results of the model:
Table 4. Full Model Results (Conflict).

Variable

Estimate

SE

t-value

p-value

Intercept

1.514

0.092

16.47

< 2 × 10¹⁶

Precipitation

0.262

0.096

2.72

0.0074

From the results, precipitation shows the highest correlation with conflict, with a p- value of 0.0074. Price shows a significance that is borderline (p = 0.062), indicating potential non-linear effects. These results emphasize on importance of environmental factors, mainly precipitation, in conflict dynamics.
4.4. SpatioTemporal Neural Networks
Introduction
Migration, moreso conflict arising from displacement and economic crises, is a complexity led by many spatiotemporal factors. This study explored the use of SpatioTemporal Neural Networks (STNN) in modelling migration patterns and predicting displacement in zones prone to conflict and climatic disruptions. Study involved an analyses of both lagged and current variables like food prices, precipitation, and intensity in conflict.
Methodology
Using a multi-lagged input structure, we put into practice a Spatio-Temporal Neural Network (STNN) model to forecast displacement and conflict outcomes. A Long Short-Term Memory (LSTM) architecture was used to capture the temporal dependencies, and specific spatial coordinates (latitude and longitude) were used as input characteristics to describe the spatial components. Instead of using a formal Graph Convolutional Network (GCN), we used sequence modeling and designed features to address spatial structure.
Preprocessing
Our dataset, which integrated factors such commodity prices, displacement numbers, precipitation, and conflict indicators (e.g., Goldstein scores), spanned the period from January 2016 to December 2022. To capture the delayed effects of these variables, a three-month lag structure was used. Row-wise deletion was used to eliminate missing values that were introduced by lagging. StandardScaler from scikit-learn was used to normalize the remaining features using z-score normalization.
Listwise deletion was used to deal with missing values introduced by lagging; that is, any rows containing NaN values were completely eliminated from the dataset. To make sure the lagging process ran on a full baseline, a SimpleImputer with a mean approach was used prior to lagging for any additional possible missing records in the raw dataset.
Test, Validation, and Train Splits
We used an 80/20 split to separate the dataset into training and test sets in order to assess model performance. The test set, which was not utilized for training, was used to calculate the final reported R^2 values (0.89 for displacement and 0.84 for conflict). By standardizing solely on the training data, we prevented data leakage even if the split was arbitrary. Future iterations will use explicit spatial and temporal holdouts, even though spatial generalization was evaluated implicitly because of the dataset's geographic diversity.
Dataset and Features
The dataset for this study was made up of several spatial and temporal features and also key predictors related to migration.
Temporal and Spatial Features
The following were features considered in the model:
1. latitude, longitude, Month, year
2. precipitation, conflict severity (Goldstein Score), Food price, displaced persons.
Lagged Variables
To account for effects in delay, lagged variables were included for three periods:
1. Food price and Precipitation
2. Displaced people
3. Goldstein Score
These variables help capture the spatiotemporal aspects of migration over time.
Model Training
The STNN models were trained using various configurations to identify the most effective architecture for predicting migration patterns. The table below summarizes different training configurations performance.
Table 5. Comparison of SpatioTemporal Neural Network Training Configurations for Displacement Prediction.

ID

Hidden

Layers

Optimizer

LR

Epochs

Loss

R2

1

200

2

AdamW

1 ×10⁵

300

7.16

0.62

2

300

3

Adam

5 ×10⁶

500

6.32

0.66

3

300

3

Adam

5 ×10⁶

500

6.35

0.65

4

300

3

Adam

5 ×10⁶

500

6.09

0.67

5

300

3

RMSprop

5 ×10⁶

500

5.90

0.68

6

300

3

Adagrad

5 ×10⁶

500

8.48

0.58

7

300

3

AdamW

5 ×10⁶

500

6.34

0.65

8

300

3

AdamW + Learning Rate Scheduler

5 ×10⁶

700

3.83

0.77

9

400

4

AdamW + ReduceLROn- Plateau

1 ×10⁵

1000

3.45

0.79

10

400

4

AdamW + ReduceLROn- Plateau

5 ×10⁵

1000

3.17

0.81

11

500

4

RMSprop + CosineAn- nealing

5 ×10⁵

1200

2.54

0.86

12

500

4

RMSprop + CosineAn- nealing

5 ×10⁵

1200

2.24

0.89

Visual Comparison (Model 2vs Model 12)
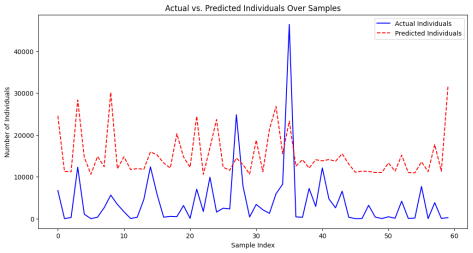
Figure 4. Model 2 perfomance visualization.
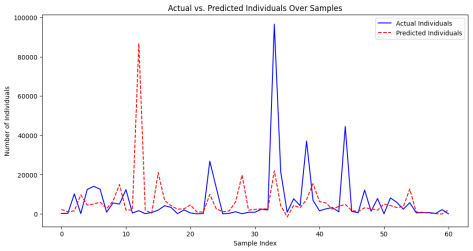
Figure 5. Model 12 perfomance visualization.
4.6. Model Interpretation and Evaluation
The models were evaluated based on their ability to make generalizations on spatiotem- poral migration patterns, with model’s loss and R2 scores having most attention.
Key Insights
1. lagged variables Integration like food prices, precipitation anomalies, and conflict shocks significantly improved model performance by capturing delay in displace- ment effects.
2. Model 12 achieved the best data generalization, with 2.24 being the lowest loss and the highest R2 of 0.89. This model benefited from a large network architecture.
3. and a cosine annealing learning rate schedule.
4. Performance improved with increased network capacity, adaptive optimizers, and dynamic learning rate schedules.
4.7. Model Performance
Model 12 achieved an R2 of 0.89, explaining 89% of the variance in migration, a signif- icant improvement over other model configurations.
Displacement Trends and Forecast
The model’s predictions were crosschecked against real-world data, with notable findings regarding displacement peaks and trends.
Peak Times of Displacement
1. January 2021: Al-Fashir recorded the highest predicted displacement (~3,000), due to ongoing conflict and high food prices.
2. January 2022: Al-Fashir remained a major hotspot with 2,750 displaced persons, indicating continous instability.
Localized Surges
1. April 2021: Another rise in displacement in Al-Fashir (~2,200 displaced).
2. January 2021: Er Rahad also saw great displacement (~2,000).
Trends in Stabilization
In late 2022, areas that were outside Central and Southern Darfur showed declining or reduced displacement, main possibility due to temporary de-escalation or an improvement in food security.
The following figures show displacement trends:
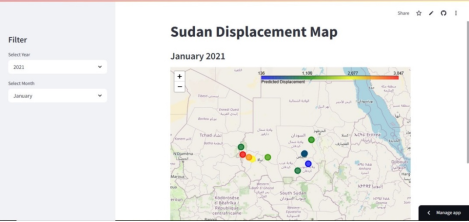
Figure 6. January 2022 Displacement Predictions.
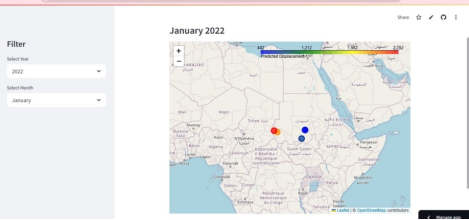
Figure 7. January 2022 Displacement Predictions.
APP ACCESS
For real time access to displacement app use link below You can access the map applica- tion at https://elevatedaily-streamlit-heroku-mapapp-app-gr6x5m.streamlit. app/.
4.8. SpatioTemporal Neural Network for Conflict Prediction
Dataset and Feature Engineering
The data for predicting conflict included both current and lagged features to model the spatiotemporal aspects of conflict and migration.
1. Temporal and Spatial Features: latitude, longitude,, Month, year
2. Core Indicators: Food price, precipitation
3. Lagged Variables (lags = 1, 2, 3):
1). Food price and Precipitation
2). Goldstein Score
Conflict Prediction Model
To model prediction of conflict, the SpatioTemporal Neural Network (STNN) was used, with a core focus on incorporating spatiotemporal dependencies and understanding the relationship between environmental and socioeconomic conditions.
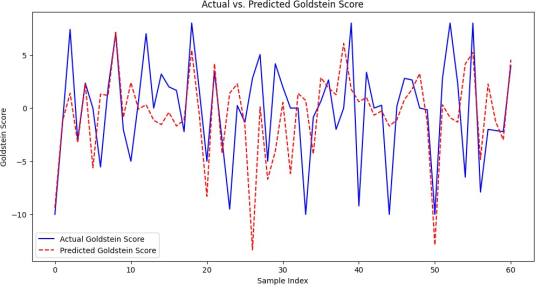
Figure 8. Conflict Prediction model visualization.
Model Comparison: SpatioTemporalNN
The research evaluated the performance of the STNN model under dynamic configurations of training parameters. The following table summarizes the comparison:
Table 6. Comparison of SpatioTemporalNN Model Performance Under Varying Training Configurations.

Model ID

Hidden Size

Layers

Optimizer

LR

Epochs

Scheduler

Loss

R2 Score

1

500

4

RMSprop

5 × 10⁵

1200

CosineAnnealingLR

3.64

0.84

2

500

4

RMSprop

5 × 10⁵

1000

CosineAnnealingLR

3.80

0.83

Interpretation of Model Results
The final most model achieved an R2 score of 0.84, indicating that 84% of the variation in conflict was explained by the model. A visualised comparison of the actual vs. predicted data values, as shown in Figure 8, indicates that the predicted trends closely synched with the observed data after parameter tuning.
Conflict Trends Projected
The model’s predictions on conflict hotspots for 2021 and 2022 were crosschecked against real-world data, which indicated regionalized changes in intensity of conflict.
Red Conflict Areas (High Conflict Intensity)
1. 2021: West, Central, and South Darfur, South Kordofan
2. 2022: West Darfur, South Darfur
Green Peace Areas (Low Conflict Intensity)
1. 2021: Blue Nile, White Nile, East Kordofan
2. 2022: South Kordofan, White Nile, Sennar
Interpretation: The general conflict intensity appears to have subsided. The dominance of green and yellow markers suggests conditions improvement in many regions, possibly due to ongoing efforts of de-escalation.
Visual Trends of Projected Conflict Areas
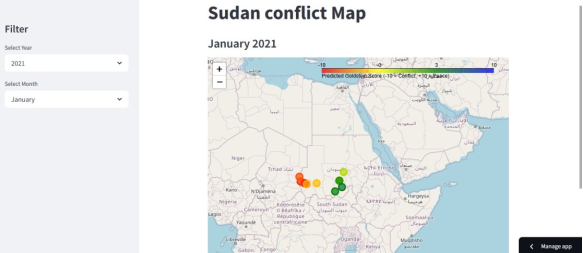
Figure 9. Conflict Prediction for January 2021.
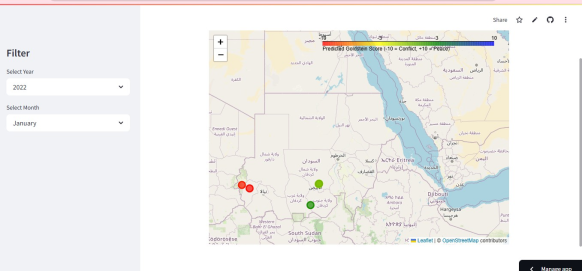
Figure 10. Conflict Prediction for January 2022.
4.9. App Access
For a real-time, interactive conflict map based on the model’s predictions, visit the ap- plication:
https://conflict-map-mtujdmkjdsvticwpadeffw.streamlit.app/
Conclusion
The SpatioTemporal Neural Network model provided important details into prediction of conflict, showing spatiotemporal patterns in displacement driven by conflict and envi- ronmental factors. The model’s ability to predict both the intensity and future conflicts location has vital implications for humanitarian planning and intervention strategies in conflict-prone regions.
The next steps for this research include fine tuning the model with data sources being added, such as satellite imagery and social media feeds, to enhance further the accuracy and granularity of conflict predictions.
5. Conclusion
Objective 1: To Quantify relationships between climate change, migration, conflict, and external factors using General Additive Models.
1. Price had a significant but non-linear impact on displacement; both extreme highs and lows were related with more movement. Even though not as strong, its corre- lation with conflict was non-linear and significant to a margin.
2. Precipitation showed a distinct, linear, and positive association that is signifi- cant statistically with conflict intensity, but it had minimal predictive power for displacement.
3. Goldstein Score demonstrated a negative correlation with displacement, hence supporting the theory that higher migration rates are mainly a result of more severe conflict.
Objective 2: Predict Conflict Intensity and Migration Rates Using STNN.
1. The SpatioTemporal Neural Network (STNN)’s final configuration demon- strated great accuracy by achieving R2 = 0.89 for migration prediction and R2 = 0.84 for conflict intensity modeling.
2. Throughout the under review years, places like Al-Fashir and Er Rahad were regularly identified as conflict-prone. The model’s accuracy and dependability were enhanced greatly by advancements in learning rate scheduling and depth in network.
Objective 3: Deploy Applications for Conflict and Migration Monitoring.
1. To make outcomes from forecast available to stakeholders, interactive platforms that are user-friendly were introduced.
2. With their user-friendly visual outputs, these technologies facilitate real-time data analysis helping in decision-making.
6. Recommendations
1. Aligning Policy with Forecast Insights:
National agencies and humanitarian actors are supported to integrate predictive insights into their frameworks of operation. Priority should be given to deployment of timely aid and targeted interventions in consistently high-risk areas such as Er Rahad and Al-Fashir.
2. Using Web-Based Tools:
Field teams and analysts might gain from the introduced digital applications. Their mode of design makes it simple to integrate them with monitoring continously or early warning systems.
3. Expand Data Sources:
Future prediction models will be a lot more flexible and deep contextually if social variables, mobile movement patterns, and real-time media signals are Incorporated.
4. Develop Early Warning Systems:
The findings embolden the responsive, lightweight alarm systems creation, targeted at high-risk areas in order to improve emergency preparedness and early readiness.
5. Enhance Models:
For more reliable forecasting frameworks, future versions should incorporate socioe- conomic, political, and environmental factors and add data from datasets that are changing.
6. Capacity Building and Training:
To ensure that findings from analysis impact policy and action locally, it is of importance to train local experts in interpretation of the model and tool usage.
Abbreviations

GDELT

Global Database of Events, Language, and Tone

GAMS

General Additive Models

STNNS

Spatial Temporal Neural Networks

GNN

Graph Neural Networks

RNN

Recurrent Neural Networks

LSTM

Long Short-Term Memory Networks

GRU

Gated Recurrent Units

CNN

Convolutional Neural Networks

SDG

Sustainable Development Goals

Conflicts of Interest
The authors declare no conflicts of interest.
References
[1] G. J. Abel, M. Brottrager, J. C. Cuaresma, and R. Muttarak, “Climate, conflict and forced migration,” Global Environmental Change, vol. 54, pp. 239–249, 2019.
[2] Africa Institute on Internal Displacements (AFIID), “Climate change and displacement in Africa: A growing crisis,” Nov. 12, 2024.
[3] A. A. Ahmed and H. M. I. S., “Environmental variability and migration patterns in Sudan: A gravity model approach,” Journal of Environmental Studies, vol. 24, no. 3, pp. 45–60, 2018.
[4] A. H. Ali, “Sudan’s puzzle: Confronting climate change in a war-torn state,” Middle East Council on Global Affairs, 2024.
[5] S. Berkani, E. Benkhelifa, and S. Meraghni, “Deep learning models for spatio-temporal forecasting: A comprehensive review,” Neural Computing and Applications, vol. 35, no. 1, pp. 123–145, 2023.
[6] M. Bertetti, P. Agnolucci, A. Calzadilla, and L. Capra, “Improving the accuracy of food security predictions by integrating conflict data,” arXiv preprint, arXiv: 2410.22342, 2024.
[7] R. Black, W. N. Adger, N. W. Arnell, S. Dercon, A. Geddes, and D. Thomas, “The effect of environmental change on human migration,” Global Environmental Change, vol. 21, Suppl. 1, pp. S3–S11, 2011.
[8] C. Conte, M. M. Miglietta, and M. C. Llasat, “Climate change and its impact on the occurrence of floods in urban areas: A case study in the metropolitan area of Barcelona,” Atmosphere, vol. 10, no. 5, p. 272, 2019.
[9] J. H. Friedman, “Greedy function approximation: A gradient boosting machine,” The Annals of Statistics, vol. 29, no. 5, pp. 1189–1232, 2001.
[10] International Centre for Migration Policy Development, “Bridging climate, conflict, and displacement in the Horn of Africa: Lessons from the Khartoum Process,” 2024.
[11] International Organization for Migration – DTM, A Year in Review: Displacement in Sudan (2024), 2024.
[12] J. Mark and A. Naureen, “Machine learning approach to conflict prediction in Sub-Saharan Africa,” Sustainability, vol. 13, no. 13, p. 7366, 2021.
[13] United Nations Development Programme (UNDP), “Climate change adaptation in Sudan: Fostering resilience and peace,” UNDP Reports, 2020.
[14] R. Reuveny, “Climate change-induced migration and violent conflict,” Political Geography, vol. 26, no. 6, pp. 656–673, 2007.
[15] L. Solaa, Y. Chen, S. K. Murphy, and V. S. Subrahmanian, “Quantifying the risk of pastoral conflict in 4 Central African countries,” arXiv preprint, arXiv: 2412.18799, 2024.
[16] D. Ubilava, “Climate, crops, and postharvest conflict,” arXiv preprint, arXiv: 2311.16370, 2023.
Cite This Article
  • APA Style

    Wambui, N. R., Samuel, M., Charity, W. (2025). Modeling the Climate-Conflict-Migration Interplay in Sudan by Integrating GAMS and Spatio-Temporal Neural Networks. International Journal of Data Science and Analysis, 11(3), 63-75. https://doi.org/10.11648/j.ijdsa.20251103.12

    Copy | Download

    ACS Style

    Wambui, N. R.; Samuel, M.; Charity, W. Modeling the Climate-Conflict-Migration Interplay in Sudan by Integrating GAMS and Spatio-Temporal Neural Networks. Int. J. Data Sci. Anal. 2025, 11(3), 63-75. doi: 10.11648/j.ijdsa.20251103.12

    Copy | Download

    AMA Style

    Wambui NR, Samuel M, Charity W. Modeling the Climate-Conflict-Migration Interplay in Sudan by Integrating GAMS and Spatio-Temporal Neural Networks. Int J Data Sci Anal. 2025;11(3):63-75. doi: 10.11648/j.ijdsa.20251103.12

    Copy | Download

  • @article{10.11648/j.ijdsa.20251103.12,
      author = {Ndegwa Ruth Wambui and Mwalili Samuel and Wamwea Charity},
      title = {Modeling the Climate-Conflict-Migration Interplay in Sudan by Integrating GAMS and Spatio-Temporal Neural Networks
    },
      journal = {International Journal of Data Science and Analysis},
      volume = {11},
      number = {3},
      pages = {63-75},
      doi = {10.11648/j.ijdsa.20251103.12},
      url = {https://doi.org/10.11648/j.ijdsa.20251103.12},
      eprint = {https://article.sciencepublishinggroup.com/pdf/10.11648.j.ijdsa.20251103.12},
      abstract = {The ongoing humanitarian crises in Sudan, which are being exacerbated by escalating climate change, persistent conflict, and migratory waves, highlight the critical need for predictive, data-driven models to guide efficient response plans. In order to investigate and predict the intricate links between climate variability, conflict intensity, and migration patterns in Sudan at the subnational level, this study combines Spatio-Temporal Neural Networks (STNNs) with Generalized Additive Models (GAMs). The hybrid modeling framework provides strong insights into displacement patterns and conflict dynamics by capturing both spatial-temporal dependencies and nonlinear effects. GAMs showed a high positive correlation between conflict severity and precipitation levels, as well as statistically significant nonlinear relationships between food prices and relocation. In the meantime, the STNNs performed better than traditional modeling techniques, with R2 values of 0.89 and 0.84 for conflict intensity and regional displacement prediction, respectively. These excellent performance measures show how well the model captures real-world dynamics and provide a useful tool for humanitarian predictions. Prototype app for visualizing migration and conflict forecasts are included in the study, but they are still in the early stages of development. Future studies aim to improve operational utility and decision-making support in the field through real-time application. The results highlight how crucial it is for humanitarian research to combine machine learning and statistical modeling. This study offers practical insights that can enhance early warning systems, policymaking, and disaster preparedness in climate-vulnerable areas like Sudan by identifying important drivers of displacement and violence.
    },
     year = {2025}
    }
    

    Copy | Download

  • TY  - JOUR
    T1  - Modeling the Climate-Conflict-Migration Interplay in Sudan by Integrating GAMS and Spatio-Temporal Neural Networks
    
    AU  - Ndegwa Ruth Wambui
    AU  - Mwalili Samuel
    AU  - Wamwea Charity
    Y1  - 2025/06/16
    PY  - 2025
    N1  - https://doi.org/10.11648/j.ijdsa.20251103.12
    DO  - 10.11648/j.ijdsa.20251103.12
    T2  - International Journal of Data Science and Analysis
    JF  - International Journal of Data Science and Analysis
    JO  - International Journal of Data Science and Analysis
    SP  - 63
    EP  - 75
    PB  - Science Publishing Group
    SN  - 2575-1891
    UR  - https://doi.org/10.11648/j.ijdsa.20251103.12
    AB  - The ongoing humanitarian crises in Sudan, which are being exacerbated by escalating climate change, persistent conflict, and migratory waves, highlight the critical need for predictive, data-driven models to guide efficient response plans. In order to investigate and predict the intricate links between climate variability, conflict intensity, and migration patterns in Sudan at the subnational level, this study combines Spatio-Temporal Neural Networks (STNNs) with Generalized Additive Models (GAMs). The hybrid modeling framework provides strong insights into displacement patterns and conflict dynamics by capturing both spatial-temporal dependencies and nonlinear effects. GAMs showed a high positive correlation between conflict severity and precipitation levels, as well as statistically significant nonlinear relationships between food prices and relocation. In the meantime, the STNNs performed better than traditional modeling techniques, with R2 values of 0.89 and 0.84 for conflict intensity and regional displacement prediction, respectively. These excellent performance measures show how well the model captures real-world dynamics and provide a useful tool for humanitarian predictions. Prototype app for visualizing migration and conflict forecasts are included in the study, but they are still in the early stages of development. Future studies aim to improve operational utility and decision-making support in the field through real-time application. The results highlight how crucial it is for humanitarian research to combine machine learning and statistical modeling. This study offers practical insights that can enhance early warning systems, policymaking, and disaster preparedness in climate-vulnerable areas like Sudan by identifying important drivers of displacement and violence.
    
    VL  - 11
    IS  - 3
    ER  - 

    Copy | Download

Author Information
  • Department of Statistics and Actuarial Science, Jomo Kenyatta University of Agriculture and Technology, Juja, Kenya

  • Department of Statistics and Actuarial Science, Jomo Kenyatta University of Agriculture and Technology, Juja, Kenya

  • Department of Statistics and Actuarial Science, Jomo Kenyatta University of Agriculture and Technology, Juja, Kenya

  • Abstract
  • Keywords
  • Document Sections

    1. 1. Introduction
    2. 2. Literature Review
    3. 3. Materials and Methods
    4. 4. Results and Discussion
    5. 5. Conclusion
    6. 6. Recommendations
    Show Full Outline
  • Abbreviations
  • Conflicts of Interest
  • References
  • Cite This Article
  • Author Information